Content from Many Facets of Reproducibility
Last updated on 2025-12-30 | Edit this page
Overview
Questions
- What is reproducibility?
Objectives
- Describe a conceptual framework for reproducibility.
- Explain how and why adopting reproducible practices benefits research.
Introduction
What does reproducibility mean? This is not and easy question to answer because it has different definitions depending on the discipline. Reproducibility is distinct from replicability, although the two are often used interchangeably (Barba, 2018, Schloss, 2018).To start we need to state our definition so that we can all be on the same page.
Reproducible research Authors provide all the necessary data and code to run the analysis again, re-creating the results.
Replication A study that arrives at the same scientific findings as another study, collecting new data and completing new analyses.
Replication requires reproducibility but has a higher goal to re-run an entire study rather than only re-create original results using the same data and code. In replication you’re running a whole new study, obtaining new data, and running a new analysis.
| Methods | Same Data | Different Data |
|---|---|---|
| Same methods | Reproducibility | Replicability |
| Different methods | Robustness | Generalizability |
The table above is adapted from The Turing Way. When you use the same methods and the same data as the original study and get the same results, that is reproducibility. If you get the same results using the same data but different methods, such as using a different statistical approach, that is robustness. That means the study’s findings are robust to changes in the methods. If you are gathering new data and rerunning another study with the same methods and get the same findings, that study is replicable. Finally, what we all are hoping to be able to achieve is to be able to not only replicate a study and get the same results, but to have those results replicate to different populations or different analysis methods. That is the gold standard of reproducibility and means you are making a big contribution to research. (Reproducibility for Everyone, Schloss, 2018)
Reproducibility is not all that matters
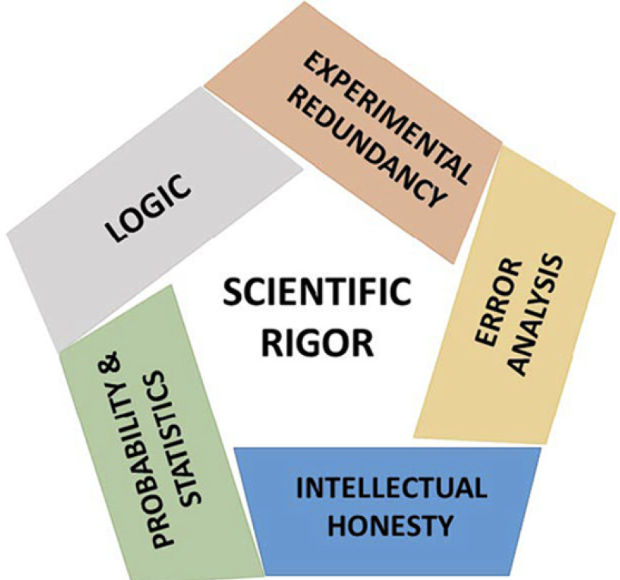
Reproducibility is only one aspect we need to try to improve in science. There are several others as well that influence scientific rigor. We should aim to do a little better every time we carry out a study and be aware of these other aspects of rigorous science.
Factors that decrease reproducibility
There are many factors affecting reproducibility: technical, human, study design and statistics, and problems with rewards and incentives. It’s complex in that issues with reproducibility arise out of many smaller decisions and environments that we encounter in research.
| Factors | Examples |
|---|---|
| Technical | Bad reagents or cell lines, natural variability |
| Study design & statistics | Design flaws, misused methods, batch effects |
| Human | Poor record keeping or sharing, confirmation bias |
| Rewards & incentives | Fraud, paywalls, perverse incentives |
Other examples, like mistakes and lack of training, encompass all of these factors - technical, study design, statistical, human, and rewards and incentives. It’s best to think of this this as an opportunity for us to do better, as a community and as as individuals over time, rather than being overwhelmed by what has been described as a reproducibility crisis. We need to learn a little bit about how to do science better with the new methods, information, and understanding that we gain. Think about reproducibility as an incremental process. Every time you start a new project, you can make one change to make it a little bit more reproducible, to make it a little bit more transparent. Then you’re on the right path towards improving and accelerating your work. So better methods, more data, more power. Larger studies, less pressure to publish, fewer incentives to be first rather than right, sharing reagents and code, and sharing all of your information about your statistical packages.
We need more incentives to actually reproduce each other’s work, and for labs to reproduce each other’s work. In this lesson we will stay with the simple case of results reproducibility - using the same data and code to generate the same results (or not!). This gives us the opportunity to look at some of issues that prevent even the simplest case of results reproducibility, so that we might adopt some new practices or change our existing ones a bit.
Challenge 1: The efficient technician
Your technician colleague finds a way to simplify and expedite an
experiment. The experiment applies four different wheel-running
treatments to twenty different mice over the course of five days. Four
mice are treated individually each day for two hours each with a random
selection of the four treatments. Your clever colleague decides that a
simplified protocol would work just as well and save time. Run treatment
1 five times on day 1, treatment 2 five times on day 2, and so on. Some
overtime would be required each day but the experiment would be
completed in only four days, and then they can take Friday off! Does
this adjustment make sense to you?
Can you foresee any problems with the experimental results?
Which factor(s) decreasing reproducibility does this example
demonstrate?
Since each treatment is run on only one day, the day effectively
becomes the experimental unit (explain this). Each experimental unit
(day) has five samples (mice), but only one replication of each
treatment. There is no valid way to compare treatments as a result.
There is no way to separate the treatment effect from the day-to-day
differences in environment, equipment setup, personnel, and other
extraneous variables.
This is an example of study design flaws that decrease reproducibility.
It can be remedied with training about batch effects.
Challenge 1 describes a case of batch effect, which is a common problem in biomedical studies. Data are collected in batches that confound treatment effects by running all of one category (e.g. treatment, sex, strain) at the same time. This makes it impossible to quantify the effect of the treatment.
“To consult the statistician after an experiment is finished is often merely to ask him to conduct a post mortem examination. He can perhaps say what the experiment died of.” - Sir Ronald A. Fisher, First Session of the Indian Statistical Conference, Calcutta, 1938
- Reproducibility has many definitions.
- We define reproducibility here as using the same data and methods as the original study.
- Adopting reproducible practices strengthens science and makes it more rigorous.
Content from Case Studies in Irreproducibility
Last updated on 2025-12-30 | Edit this page
Overview
Questions
- What are some common reasons for irreproducibility?
Objectives
- Describe a conceptual framework for reproducibility.
- Explain how and why adopting reproducible practices benefits research.
Problems in irreproducible research
From here we will look at some common problems in irreproducible research. We will also discuss ways to overcome these problems. Recall that our definition of reproducible research means that authors provide all data and code to run the analysis again, re-creating the results.
| Methods | Same Data | Different Data |
|---|---|---|
| Same methods | Reproducibility | Replicability |
| Different methods | Robustness | Generalizability |
We will also limit these examples to those that we can examine as analysts. The system of rewards and incentives is one that we must work within for the time being, with an eye toward improving the culture of science. It is not something that we can change in a day however. As analysts we also can’t fix some of the human or technical issues that impact an experiment. We can investigate study design and statistics, however, in data analysis. We will focus on issues with study design, misused methods, and batch effects.
| Factors | Examples |
|---|---|
| Technical | Bad reagents or cell lines, natural variability |
| Study design & statistics | Design flaws, misused methods, batch effects |
| Human | Poor record keeping or sharing, confirmation bias |
| Rewards & incentives | Fraud, paywalls, perverse incentives |
Case 1: The gene set that characterizes early Alzheimer’s disease
K.Q. Watkins and coauthors describe a unique gene set characteristic of early onset Alzheimer’s Disease. The gene expression heatmap from their paper clearly delineates Alzheimer’s patients from a neurotypical control group.
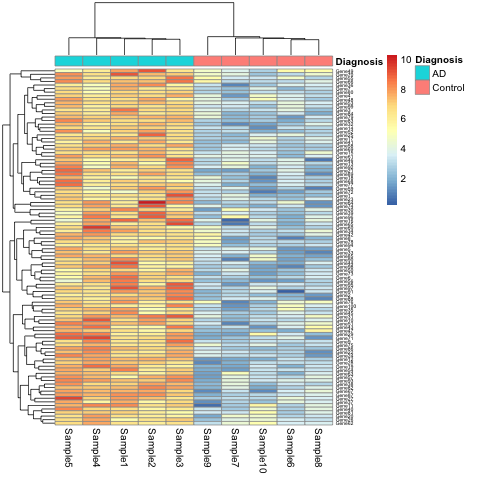
Watkins, K. Q., et al. (2022). A unique gene expression signature characterizes early Alzheimer’s disease. Nature Alzheimer’s, 33(3), 737-753.
Use the R script, the data, and the metadata to reproduce this plot.
Can you find other ways to present the (meta)data in the heatmap? What do alternate ways of presenting the data show you?
This is a simulated study and publication. Any resemblance to real persons or real studies is purely coincidental.
- You can replace
DiagnosiswithBatchin the call thepheatmap.
R
pheatmap(expr_matrix,
         annotation_col = metadata["Batch"],
         fontsize_row   = 5)
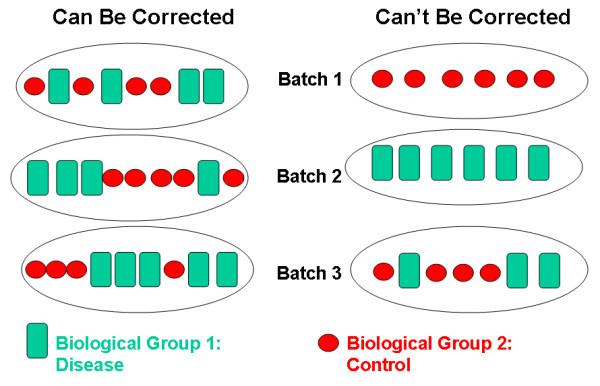
This will show the same heatmap, though in this one the legend shows batch number instead of disease state. This is an example of complete confounding between batch and diagnosis. All of the Alzheimer’s samples were run in the first batch and all of the controls in the second. There is no way to disentangle disease state from batch.
The graphic below shows an example of complete confounding at right
under Can't Be Corrected. Batch 1 contains only controls
and batch 2 only disease samples. There is no method that will be able
to discern the effect of the batch from the effect of disease or
control.
Batch effects are common and can be corrected if samples are
randomized to batch. At left beneath Can Be Corrected,
control and disease samples were randomized to each of three batches.
There can still be batch effects, however, there are methods available
(e.g. ComBat) that can correct for these effects.
Case 2: Hippocampal volume increase in mild cognitive impairment (MCI)
K.Z. Smith and coauthors describe higher mean hippocampal volume in subjects with mild cognitive impairment (MCI). The boxplots below show a clear difference in hippocampal volume between the MCI and control groups.
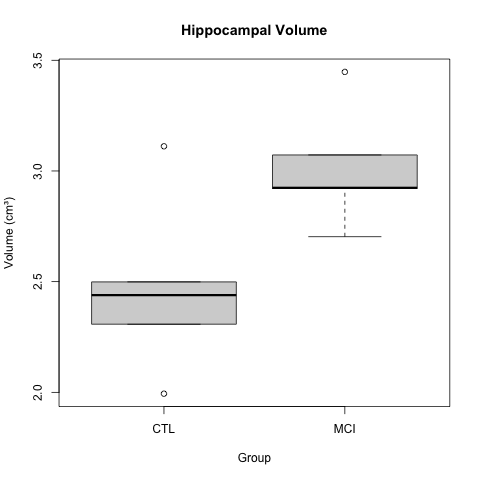
Smith, K. Z., et al. (2023). Hippocampal volume increase in mild cognitive impairment. Science Progress, 3(14), 37-53.
A t-test gave a p-value of less than 0.05 to reject the null hypothesis of no difference in means between the two groups. The boxplots appear to back up this assertion.
Use the R script and the data to reproduce the boxplot and t-test.
Create a scatterplot of the data by group to get further insight. You can also look at the entire dataset to get a sense of it.
Calculate the effect size between the two groups.
R
# Estimate effect size (Cohen's d for hippocampal volume)
library(effsize)
d_result <- cohen.d(HippocampalVolume ~ Group, data = hippocampus)
print(d_result)
- Use the effect size to calculate statistical power.
R
# Estimate power for hippocampal volume
# Using observed effect size
library(pwr)
power_result <- pwr.t.test(
  d = d_result$estimate,
  n = n_per_group,
  sig.level = 0.05,
  type = "two.sample",
  alternative = "two.sided"
)
print(power_result)
- What sample size (
n_per_group) would have resulted in 80% statistical power for this experiment?
This is a simulated study and publication. Any resemblance to real persons or real studies is purely coincidental.
R
t_test_result <- t.test(HippocampalVolume ~ Group, data = hippocampus)
print(t_test_result)

boxplot(HippocampalVolume ~ Group, data = hippocampus,
        main = "Hippocampal Volume",
        ylab = "Volume (cm³)")
R
hippocampus %>% ggplot(aes(Group, HippocampalVolume)) + geom_point()
R
# Estimate effect size (Cohen's d for hippocampal volume)
library(effsize)
d_result <- cohen.d(HippocampalVolume ~ Group, data = hippocampus)
print(d_result)
OUTPUT
Cohen's d

d estimate: -1.558649 (large)
95 percent confidence interval:
     lower      upper
-3.2238802  0.1065818
R
# Estimate power for hippocampal volume
# Using observed effect size
library(pwr)
power_result <- pwr.t.test(
  d = d_result$estimate,
  n = n_per_group,
  sig.level = 0.05,
  type = "two.sample",
  alternative = "two.sided"
)
print(power_result)
OUTPUT
     Two-sample t test power calculation

              n = 5
              d = 1.558649
      sig.level = 0.05
          power = 0.581064
    alternative = two.sided

NOTE: n is number in *each* group
R
# Update sample size to 8
n_per_group <- 8

# Estimate power for hippocampal volume
# Using observed effect size
power_result <- pwr.t.test(
  d = d_result$estimate,
  n = n_per_group,
  sig.level = 0.05,
  type = "two.sample",
  alternative = "two.sided"
)
print(power_result)
OUTPUT
     Two-sample t test power calculation

              n = 8
              d = 1.558649
      sig.level = 0.05
          power = 0.8258431
    alternative = two.sided

NOTE: n is number in *each* groupCase 3: A novel biomarker for diagnosis of Alzheimer’s Disease
Your colleague J Mackerel discovered a novel biomarker for Alzheimer’s Disease and provided you with data and an analysis script to review the finding. Run the script to load the data and reproduce the result.
One of the biomarkers had a p-value of less than .05 in a t-test comparing means of the control and Alzheimer’s groups. Your colleague is very excited and ready to go to press with this!
What do you recommend? How would you proceed? Are you convinced of the finding?
P-values are no longer useful to interpret when working with high-dimensional data because we are testing many features at the same time. This is called the multiple comparison or multiple testing problem. When we test many hypotheses simultaneously, a list of p-values can result in many false positives. This example had relatively few features, however, enough t-tests were performed to reasonably expect that a p-value less than .05 would occur.
The solution to the multiple testing problem is correction using a method such as the Bonferroni correction.
- Reproducibility has many definitions.
- We define reproducibility here as using the same data and methods as the original study.
- Adopting reproducible practices strengthens science and makes it more rigorous.
Content from Common Causes of Irreproducibility
Last updated on 2025-12-30 | Edit this page
Overview
Questions
- What are some common reasons for irreproducibility?
Objectives
- Describe a conceptual framework for reproducibility.
- Explain how and why adopting reproducible practices benefits research.
Solutions for irreproducible research
Solutions for irreproducible research already exist and are freely available. The open science movement encourages practices like data sharing and preregistration with an aim to make research freely available to everyone. Adopting open science practices accelerates scientific progress and increases trust in research findings. Greater transparency and sharing improves research reproducibility.
Reproducible research depends on understanding how experiments were
performed and how data were generated. There are two critical elements
to improve reproducibility:
1. Increased transparency and sharing of research reagents, methods, and
data
2. Accelerated sharing of results (preprints)
from Reproducibility for
Everyone
Pre-registration is public sharing of your research and analysis plan prior to starting a study by submitting it to a registry like that hosted by the Center for Open Science. Pre-registering increases research transparency and rigor, which may boost public confidence in federally funded research. Pre-registering can prevent overfitting, which happens when analysis decisions are too specific to a particular sample or study. Pre-registering also prevents some questionable research practices like p-hacking, cherry picking, or hypothesizing after results are known (HARKing).
Data sharing starts by making a data sharing plan at the outset,
before collecting any data. Data should be “as open as possible and
as closed as necessary.” The parts of the data to share should
include:
1. The raw data
2. A tidy data set
3. A data dictionary describing each variable and its values in the tidy
data set
4. An explicit and exact recipe you used to go from the raw data (1) to
tidy data and the dictionary (2,3).
adapted from Ellis SE, Leek JT.
2017. How to share data for collaboration. PeerJ Preprints
5:e3139v5
Scripts to analyze the data can also be shared on platforms like Github. Reagents and methods can be shared in appropriate repositories.
| Data Sets | Reagents | Scripts | Methods | Paper | |
|---|---|---|---|---|---|
| What | Data sets | New reagents, model organisms | Analysis scripts | Detailed methods & protocols | Preprint ahead of publication |
| Where | Repository | Repository | Developer platform | Repository | Preprint server |
| Example | Dryad | Addgene, Flybase | Github | protocols.io | AfricArXiv, BiorXiv, MedRxiv |
Accelerated sharing of research resources from Reproducibility for Everyone
P-value interpretation
A p-value can indicate a statistically significant difference between study groups. It is not enough, though, to report only a p-value. The p-value says nothing about the effect size (the observed difference between groups). If the effect size was tiny, say .01 or less, would it matter how small the p-value is? The effect is negligible, so the p-value does nothing to demonstrate practical relevance or meaning. We should question how large the effect is.
A p-value can only tell us whether an effect exists. However, a p-value greater than .05 doesn’t mean that no effect exists. The value .05 is rather arbitrary. Does a p-value of .06 mean that there is no effect? It does not. It would not provide evidence of an effect under standard statistical protocol. Absence of evidence is not evidence of absence. There could still be an effect.
P-values report statistical significance of an effect, but what we want is scientific significance. Confidence intervals include estimates of the effect size and uncertainty associated with these estimates. When reporting results, use confidence intervals.
A p-value is the probability of observing a statistic that extreme if the null hypothesis is true.
The p-value is not Probability the null is true Probability the alternative is true A measure of statistical evidence
Suppose 550 out of 10,000 genes are significant at 0.05 level
P-value < 0.05 Expect 0.05*10,000 = 500 false positives - Jeff Leek
Batch effects
no randomization with randomization still batch effects due to
technician, time of day, weather, or any other variable not under study
that influence the study nevertheless. Randomization balances out these
other variables
Small sample size and low power
Small sample size is often cost per sample statistical power is the power to detect a real effect if it exists
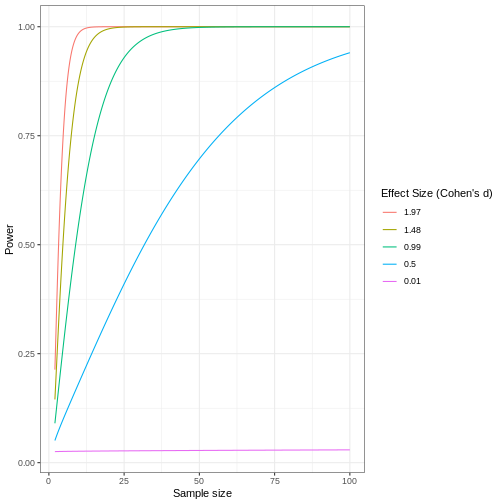
Review the following figure to explore the relationships between effect size, sample size, and power. What is the relationship between effect size and sample size? Between sample size and power?
Code adapted from How to Create Power Curves in ggplot by Levi Baguley
Notice that to detect a standardized effect size of 0.5 at 80% power, you would need a sample size of approximately 70. Larger effect sizes require much smaller sample sizes. Very small effects such as .01 never reach the 80% power threshold without enormous samples sizes in the hundreds of thousands.
- Reproducibility has many definitions.
- We define reproducibility here as using the same data and methods as the original study.
- Adopting reproducible practices strengthens science and makes it more rigorous.