Introduction to the Data Set
Last updated on 2025-09-30 | Edit this page
Estimated time: 20 minutes
Overview
Questions
- What data will we be using in this workshop?
Objectives
- Understand the experimental design of the data set.
- Understand the goals of the experiment.
Introduction
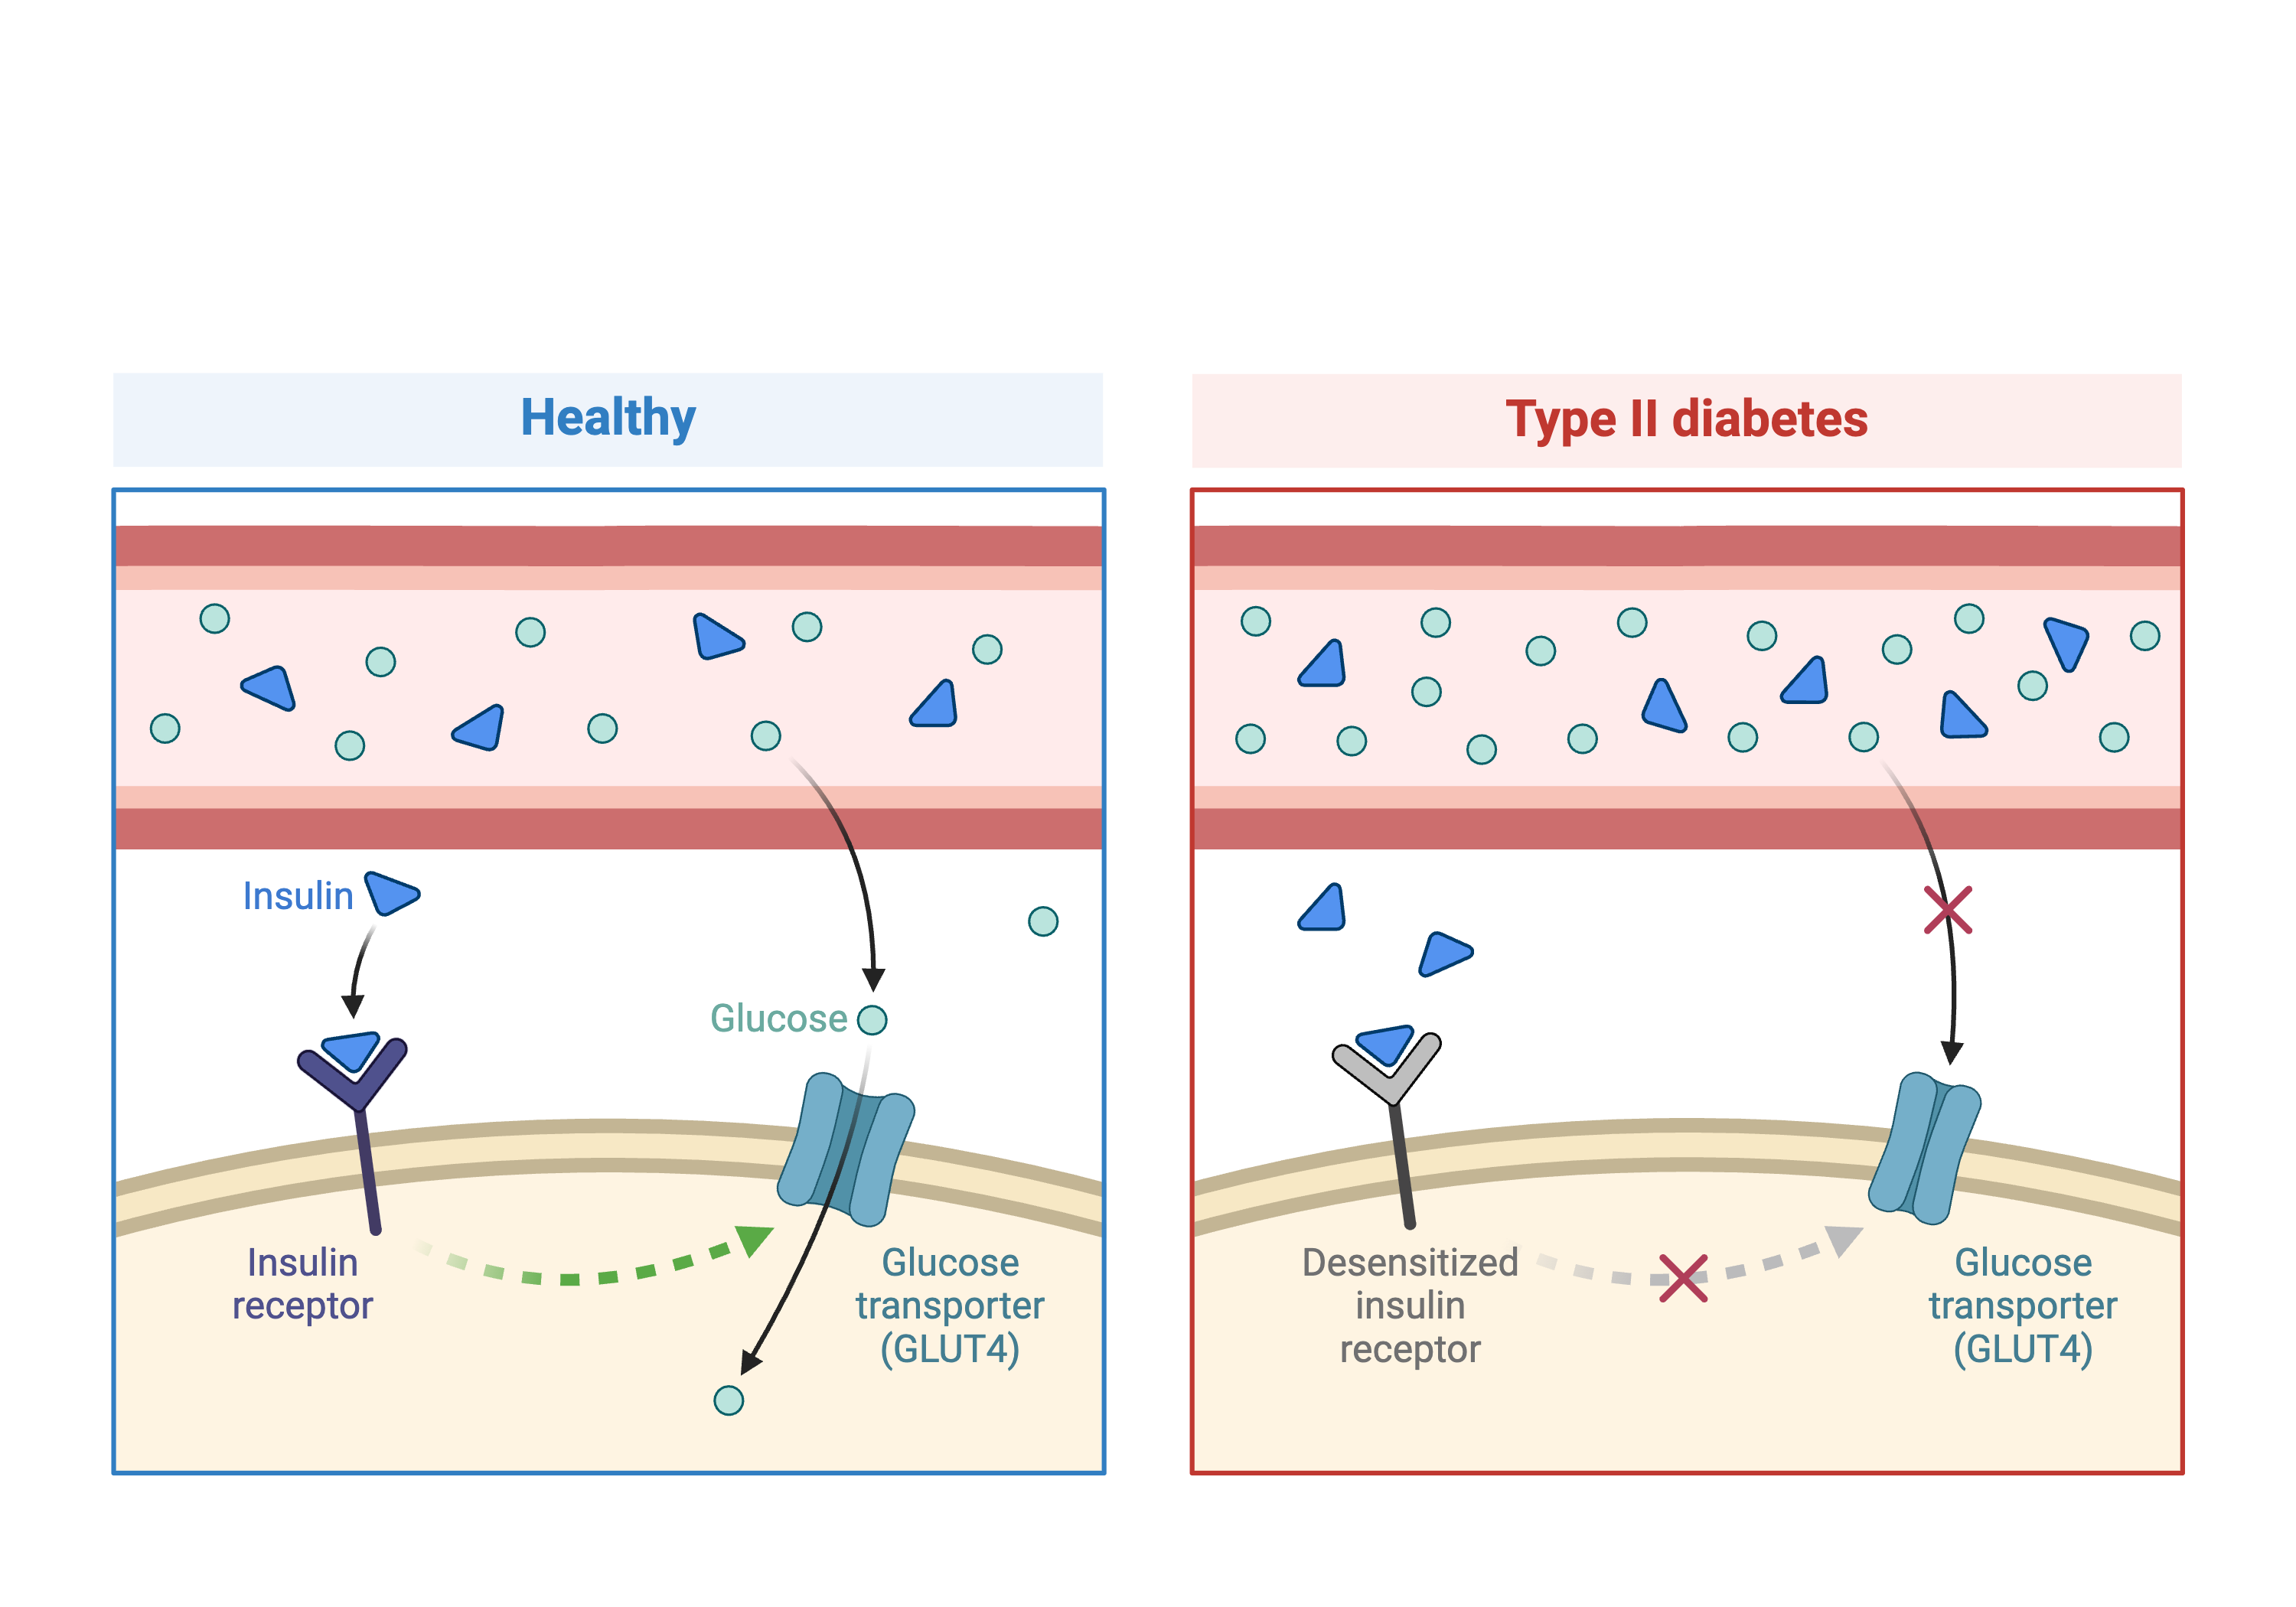
In the first part of this lesson, we will be analyzing data from a mouse experiment involving Type 2 diabetes (T2D). There are two types of diabetes: type 1, in which the immune system attacks insulin-secreting cells and prevents insulin production, and type 2, in which the pancreas makes less insulin and the body becomes less responsive to insulin.
 Created in
BioRender.com
Created in
BioRender.com
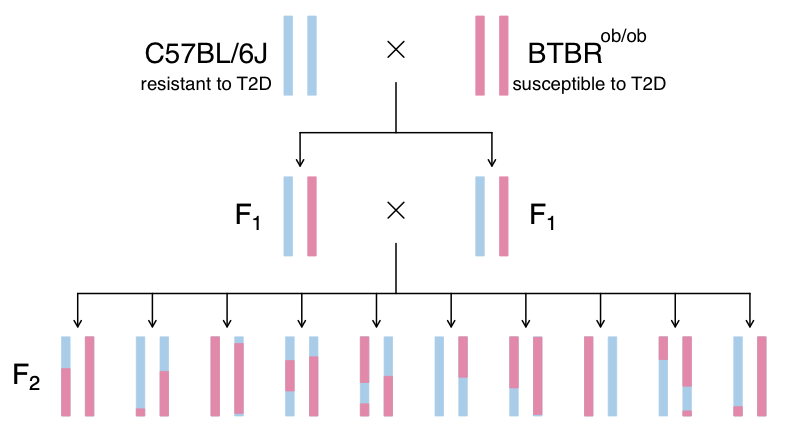
This study is from Tian et al and involves an intercross between the diabetes-resistant C57BL/6J (B6 or B) strain and the diabetes-susceptible BTBR T+ tf/J (BTBR or R) strain mice carrying a Leptinob/ob mutation.
The
This study measured insulin and glucose levels in mice at 10 weeks, at which time the mice were euthanized. After euthanasia, the authors harvested six tissues, adipose, gastrocnemius muscle, hypothalamus, pancreatic islets, kidney, and liver, and measured transcript levels via gene expression microarray.
In this study, we will analyze circulating insulin levels and pancreatic islet gene expression. We will map circulating insulin levels to identify genomic loci which influence insulin levels. We will then use SNPs that differ between C57BL/6J and BTBR and pancreatic islet gene expression data to identify candidate genes.
Challenge 1: Research question and study design
Turn to a partner and describe:
1. the research question that the study addresses, and
2. how the study is designed to address this question.
Share your description with your partner, and then listen to them describe their understanding of the study. When you are finished, write your responses into the collaborative document.
- Leptinob/ob mice do now produce insulin and become obese due to overeating.
- This study crossed mice carrying the Leptinob/ob mutation in C57BL/6J and BTBR T+ tf/J.
- C57BL/6J mice are resistant to diabetes and BTBR mice are susceptible.
- By crossing these two strains, the authors aimed to identify genes which influence susceptibility to T2D.