Genetic Drivers of Pancreatic Islet Function
Overview
Teaching: 15 min
Exercises: 15 minQuestions
How I can learn more from an example eQTL study?
What is the hypothesis of an example eQTL study?
Objectives
Describe an example eQTL study in Diversity Outbred mice.
State the hypothesis from an example eQTL study in Diversity Outbred mice.
Genome-wide association studies (GWAS) often identify variants in non-coding regions of the genome, indicating that regulation of gene expression predominates in common diseases like type II diabetes. Most of the more than 100 genetic loci associated with type II diabetes affect the function of pancreatic islets, which produce insulin for regulating blood glucose levels. Susceptibility to type II diabetes (T2D) increases with obesity, such that T2D-associated genetic loci operate mainly under conditions of obesity (See Keller, Mark P et al. “Genetic Drivers of Pancreatic Islet Function.” Genetics vol. 209,1 (2018): 335-356). Like most GWAS loci, the T2D-associated genetic loci identified from genome-wide association studies (GWAS) have very small effect sizes and odds ratios just slightly more than 1.
This study explored islet gene expression in diabetes. The authors hypothesized that gene expression changes in response to dietary challenge would reveal signaling pathways involved in stress responses. The expression of many genes often map to the same locus, indicating that expression of these genes is controlled in common. If their mRNAs encode proteins with common physiological functions, the function of the controlling gene(s) is revealed. Variation in expression of the controlling gene(s), rather than a genetic variant, can be tested as an immediate cause of a disease-related phenotype.
In this study, Diversity Outbred (DO) mice were fed a high-fat, high-sugar diet as a stressor, sensitizing the mice to develop diabetic traits. Body weight and plasma glucose, insulin, and triglyceride measurements were taken biweekly. Food intake could be measured since animals were individually housed. A glucose tolerance test at 18 weeks of age provided measurement of dynamic glucose and insulin changes at 5, 15, 30, 60 and 120 minutes after glucose administration. Area under the curve (AUC) was determined from these time points for both plasma glucose and insulin levels. Homeostatic model assessment (HOMA) of insulin resistance (IR) and pancreatic islet function (B) were determined after the glucose tolerance test was given. Islet cells were isolated from pancreas, and RNA extracted and libraries constructed from isolated RNA for gene expression measurements.
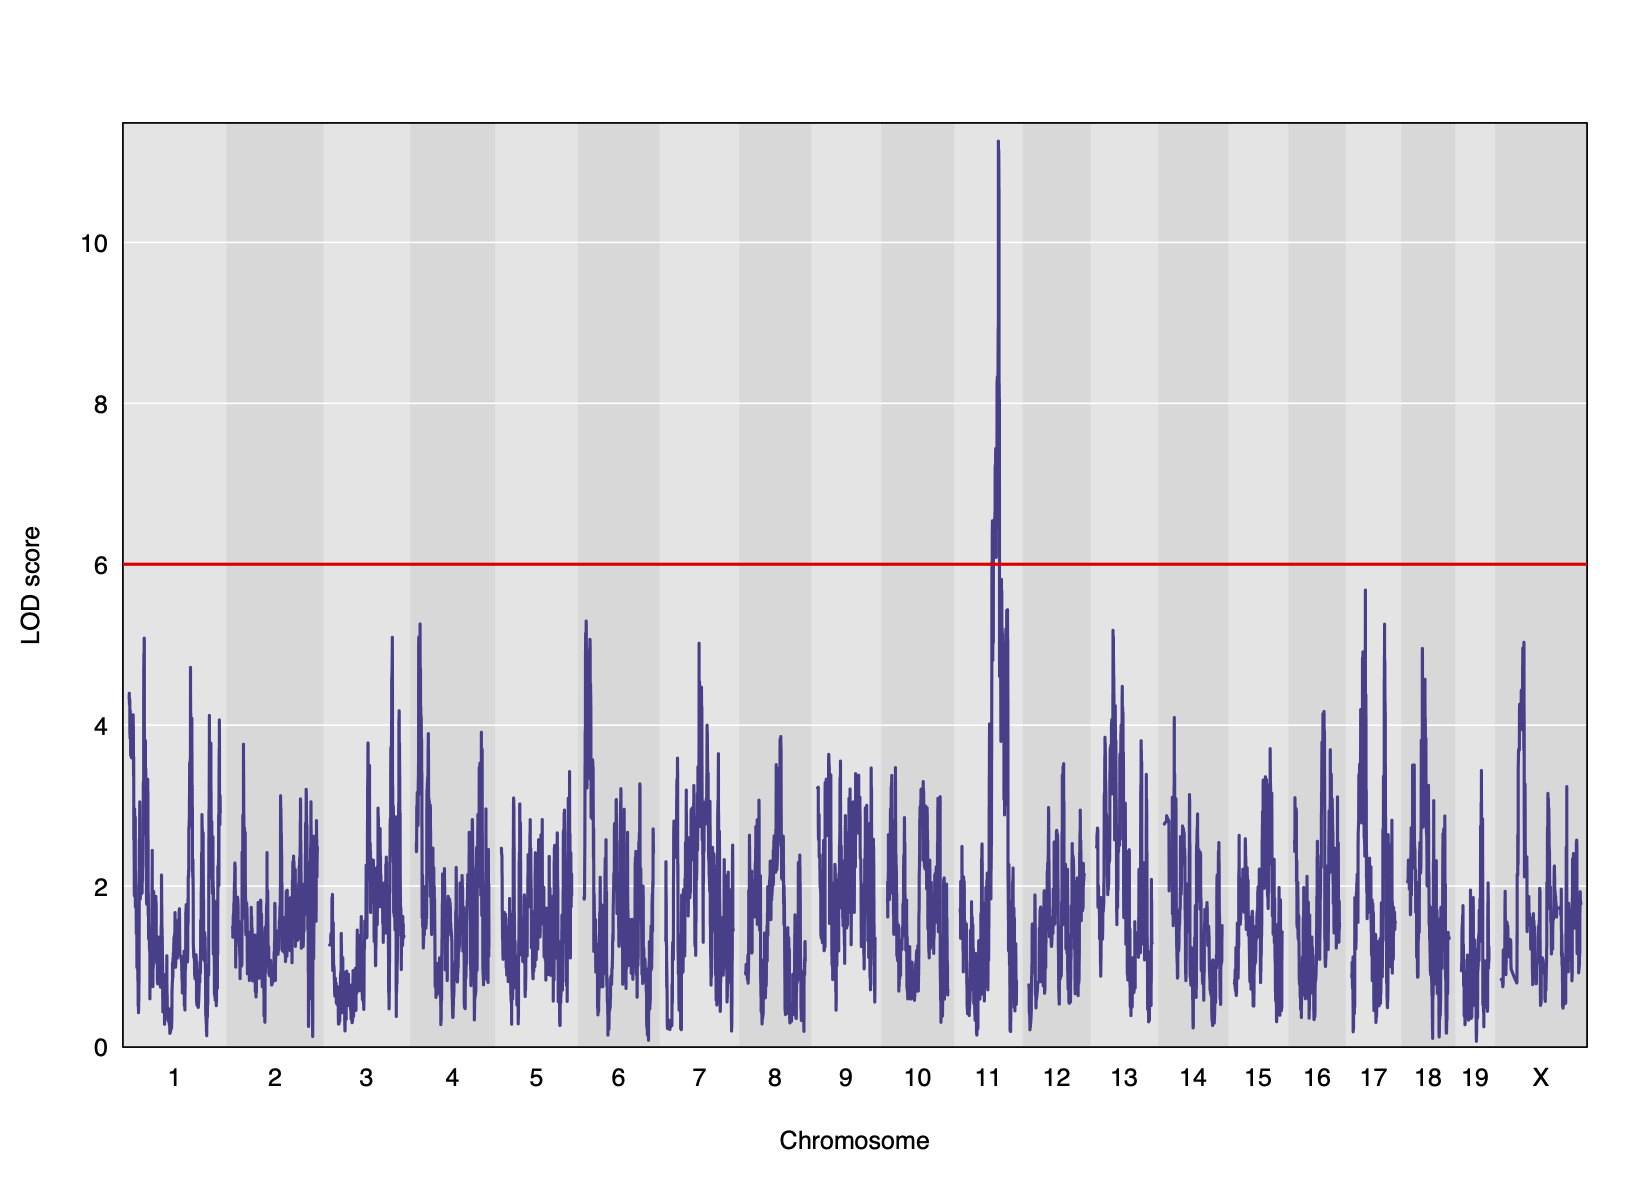
Genome scans were performed with the leave-one-chromosome-out (LOCO) method for kinship correction. Sex and experimental cohort (DO wave) were used as covariates. The results of one scan for insulin area under the curve (AUC) is shown below with a strong peak on chromosome 11. In this lesson, we will look into genes located under this peak.
Key Points
.
.