Introduction
Figure 1
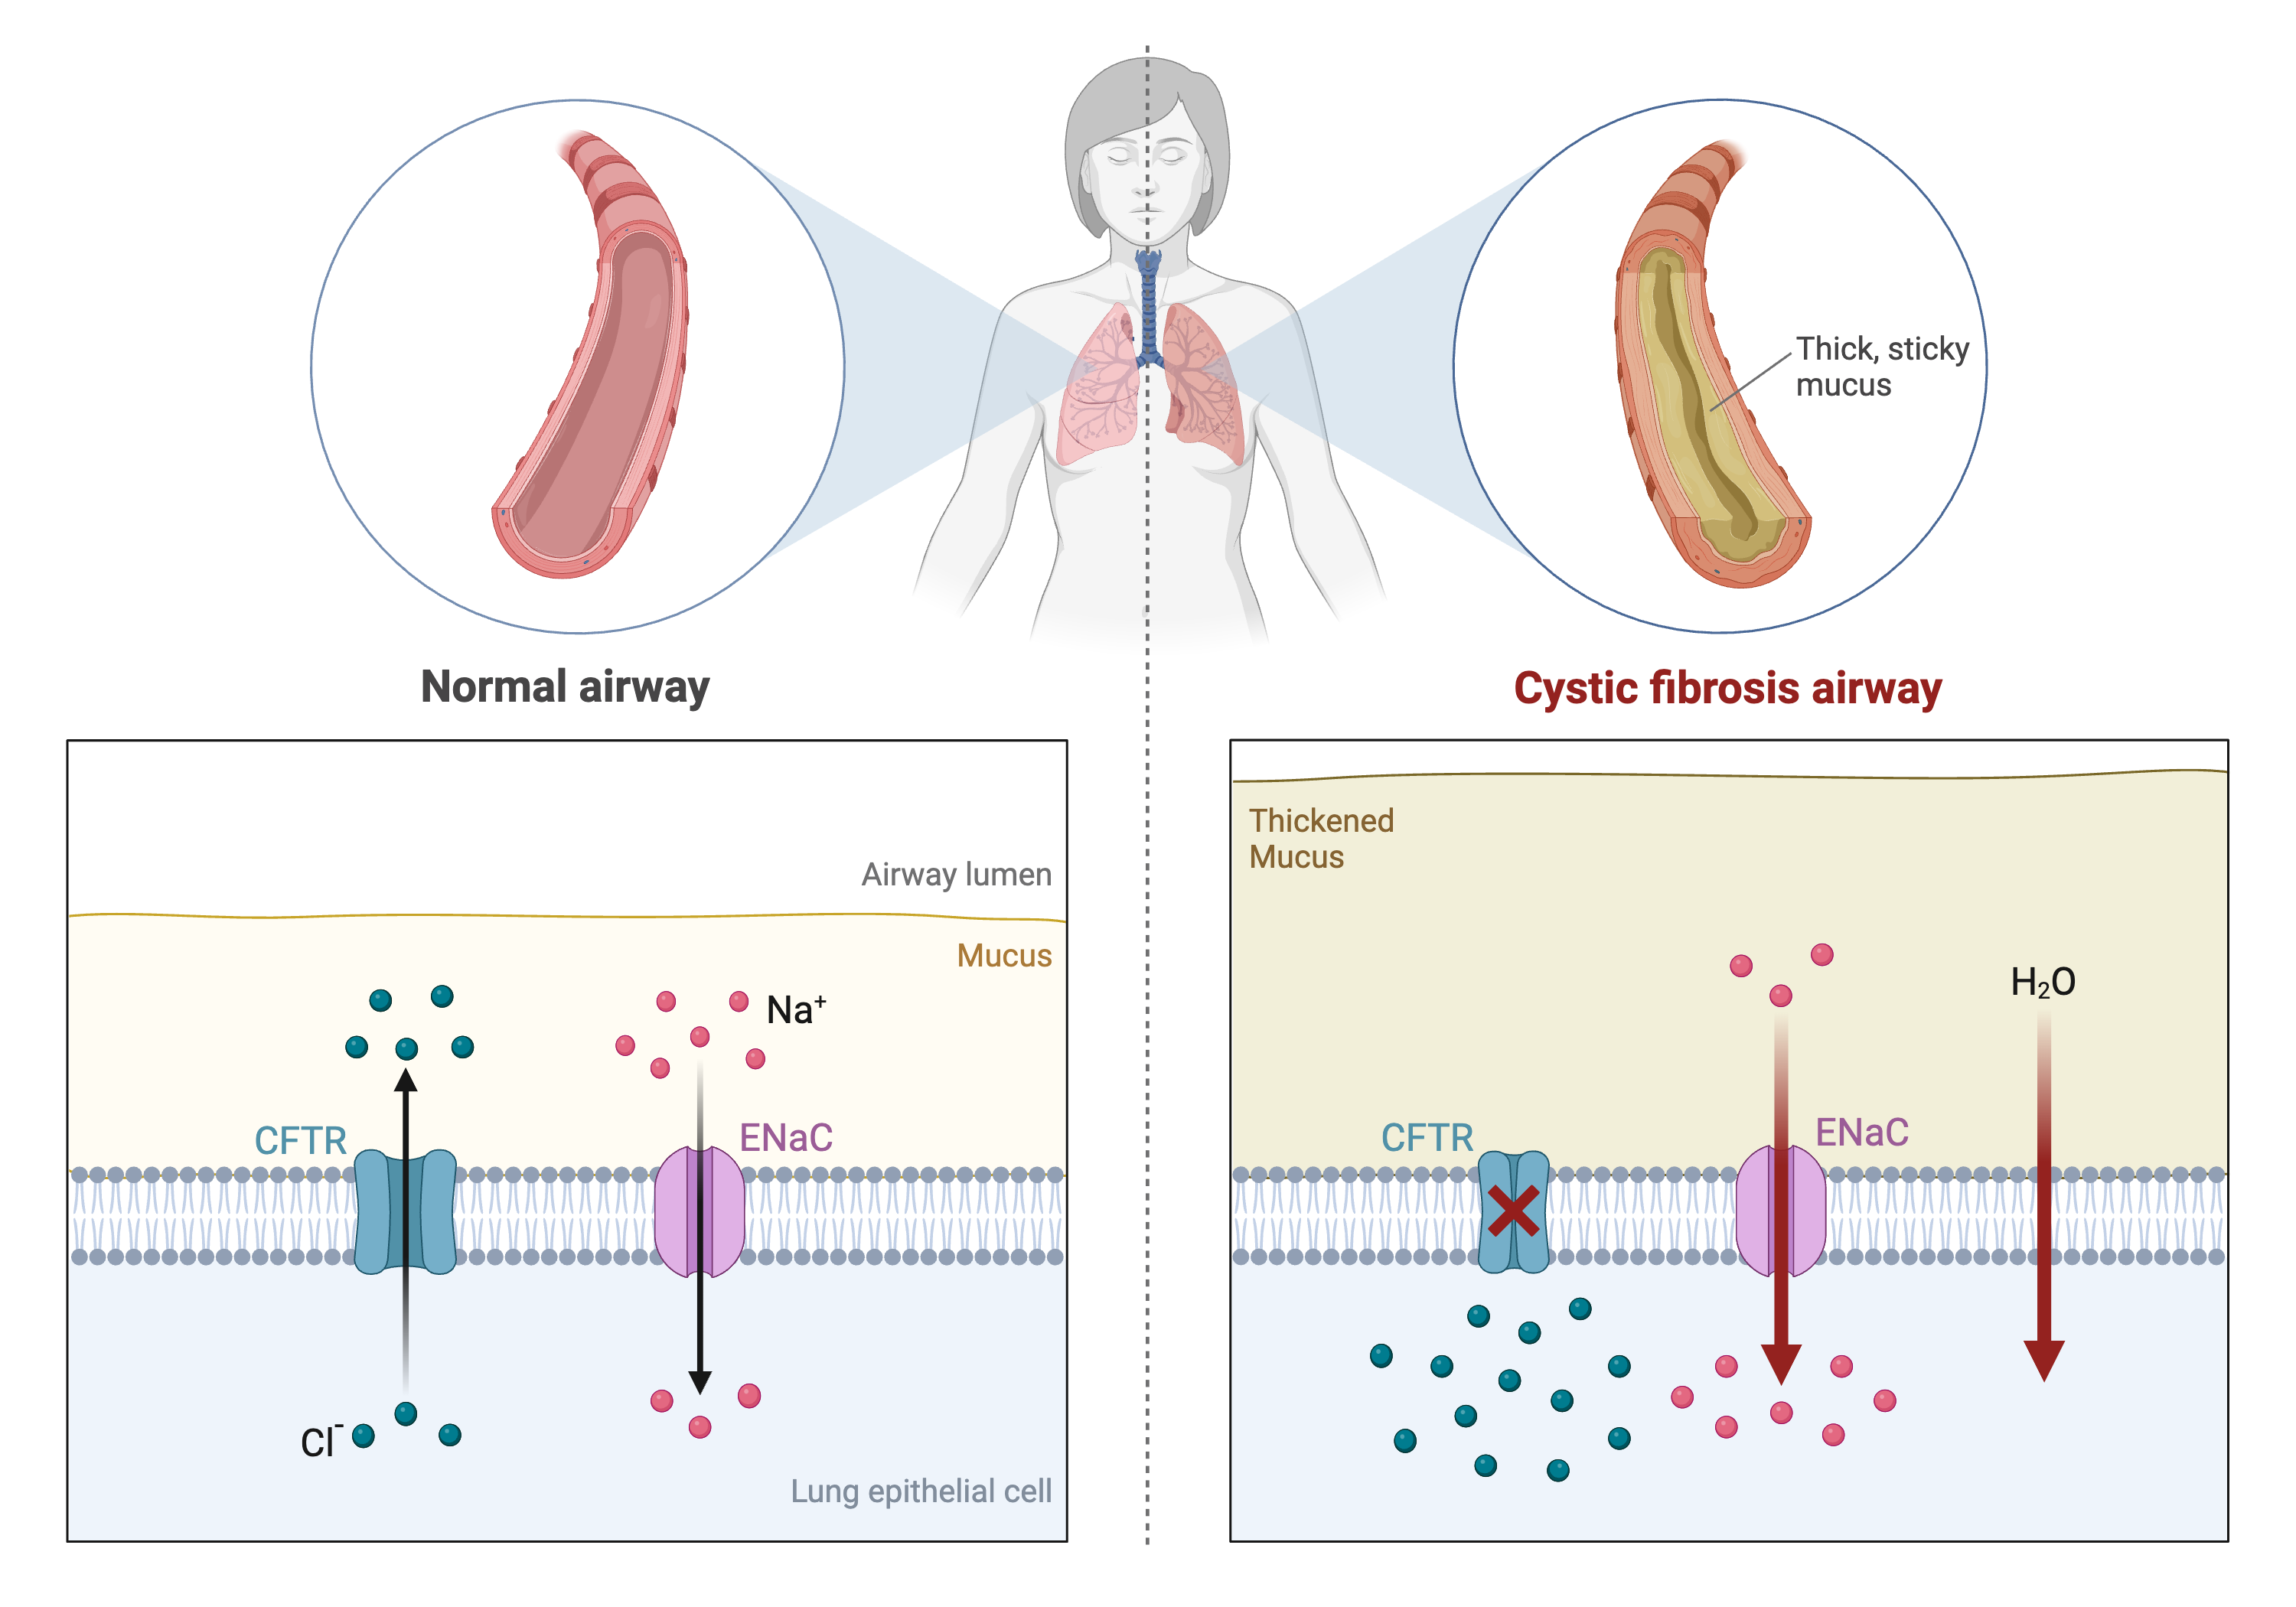
Single-gene diseases like cystic fibrosis are
relatively well understood. In cystic fibrosis mutations in the coding
region of the CFTR gene result in a defective protein. This leads to
excess mucus production that can damage the lungs and digestive
system.
Figure 2
 Excerpted from the GWAS Catalog
Figure 3
 Created
in BioRender
Created
in BioRender
Figure 4
 Created in BioRender
Figure 5
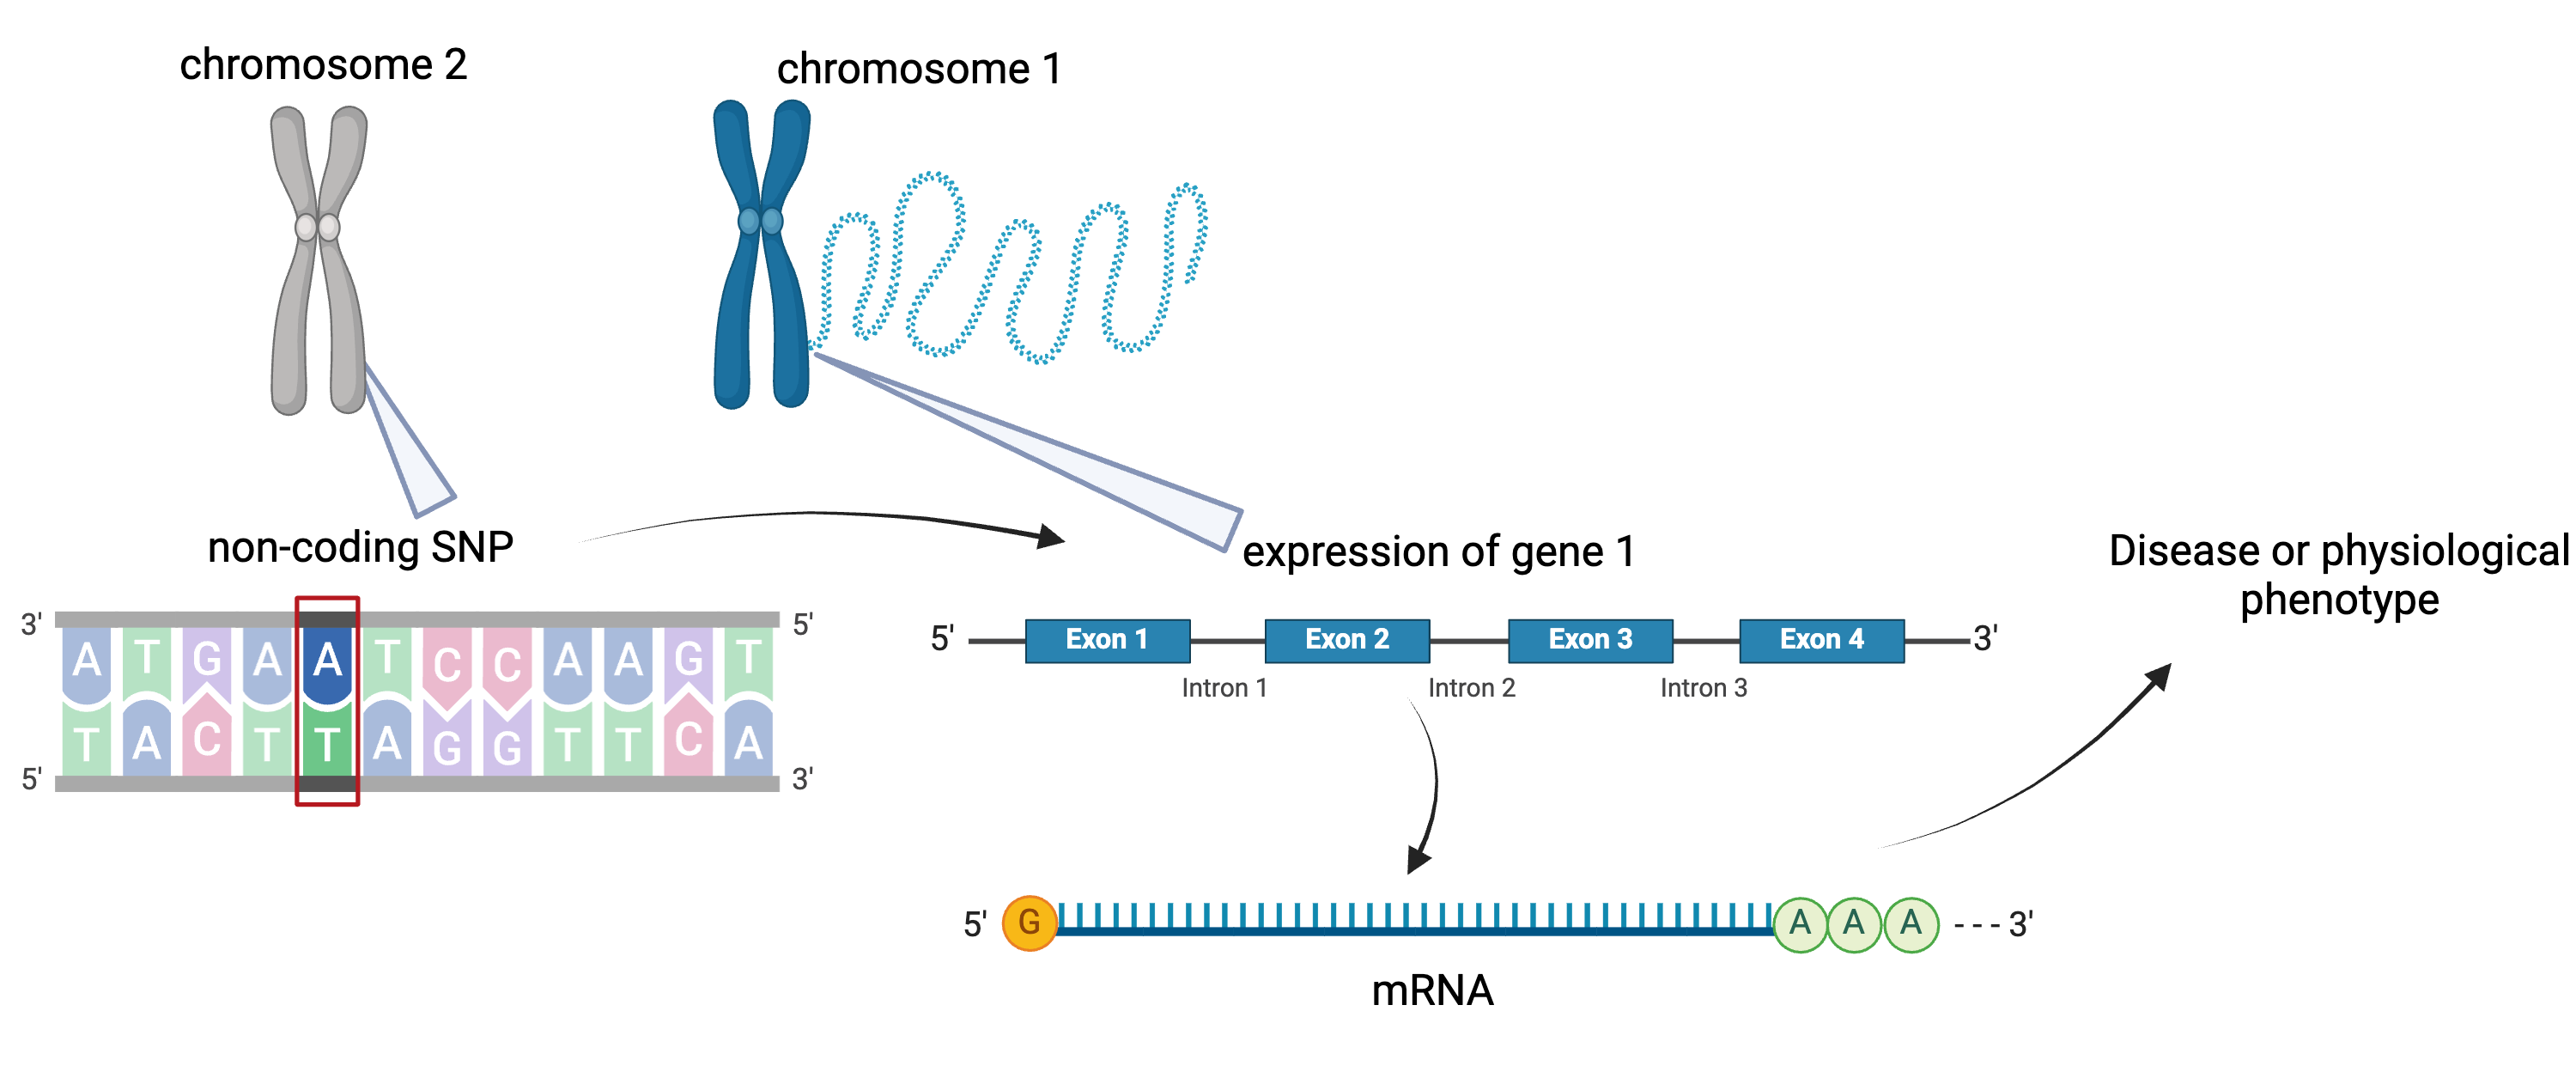
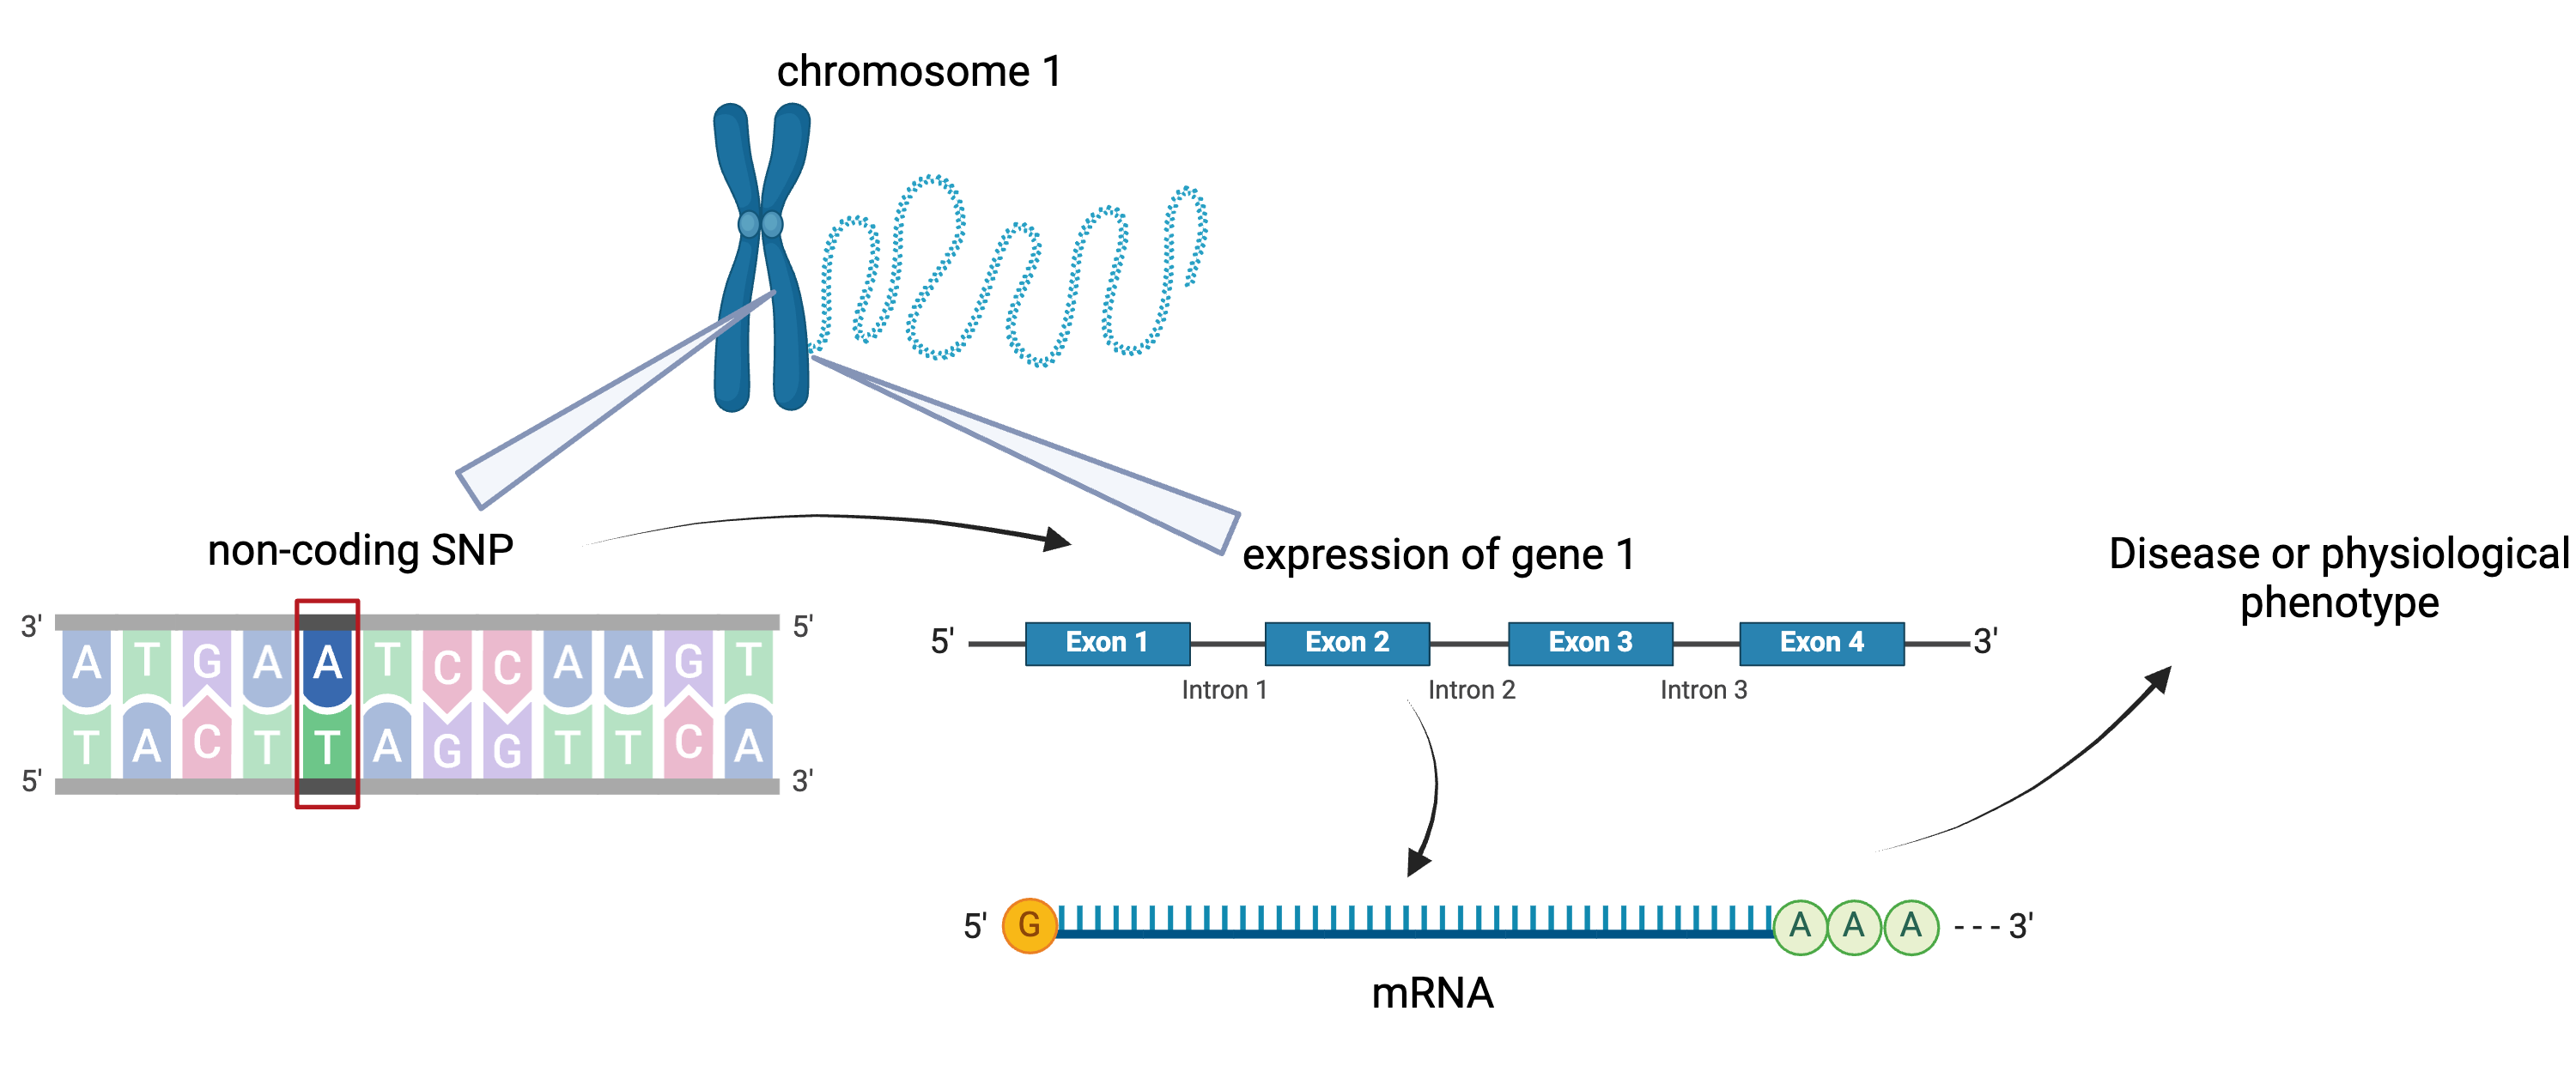
SNPs can affect gene expression distally from
the gene that they regulate, often from a different chromosome
altogether.
Figure 1
 Created in BioRender
Figure 2
 Created in BioRender
Figure 3
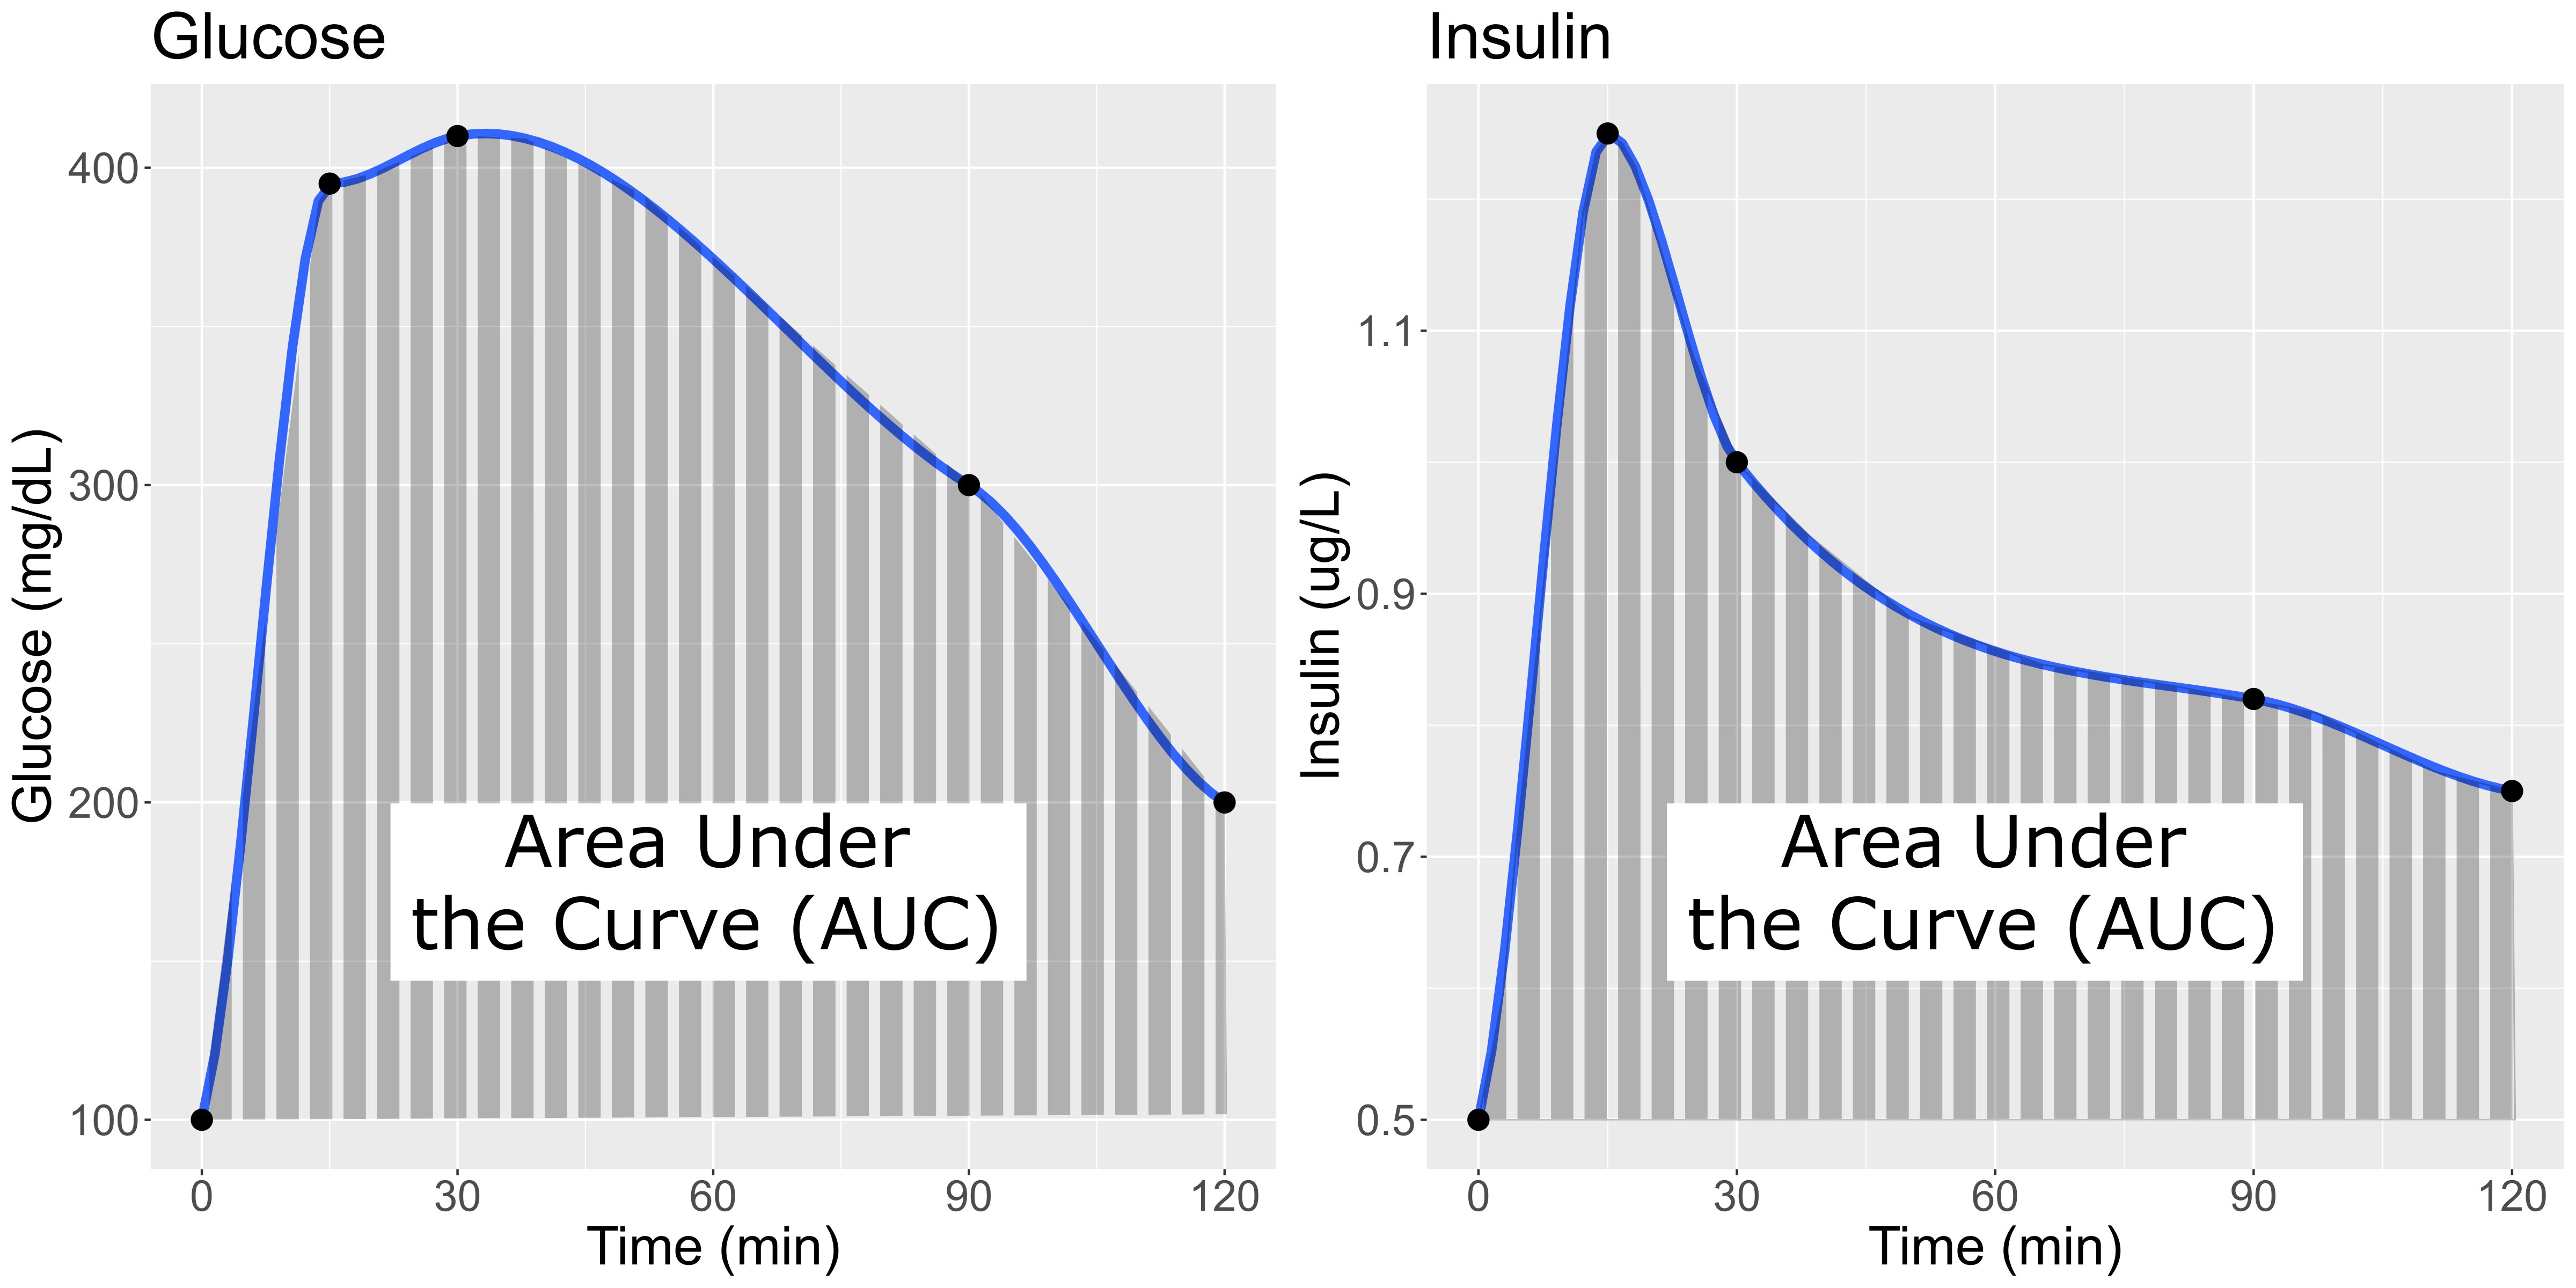
Glucose and Insulin glucose tolerance test
plots
Figure 4
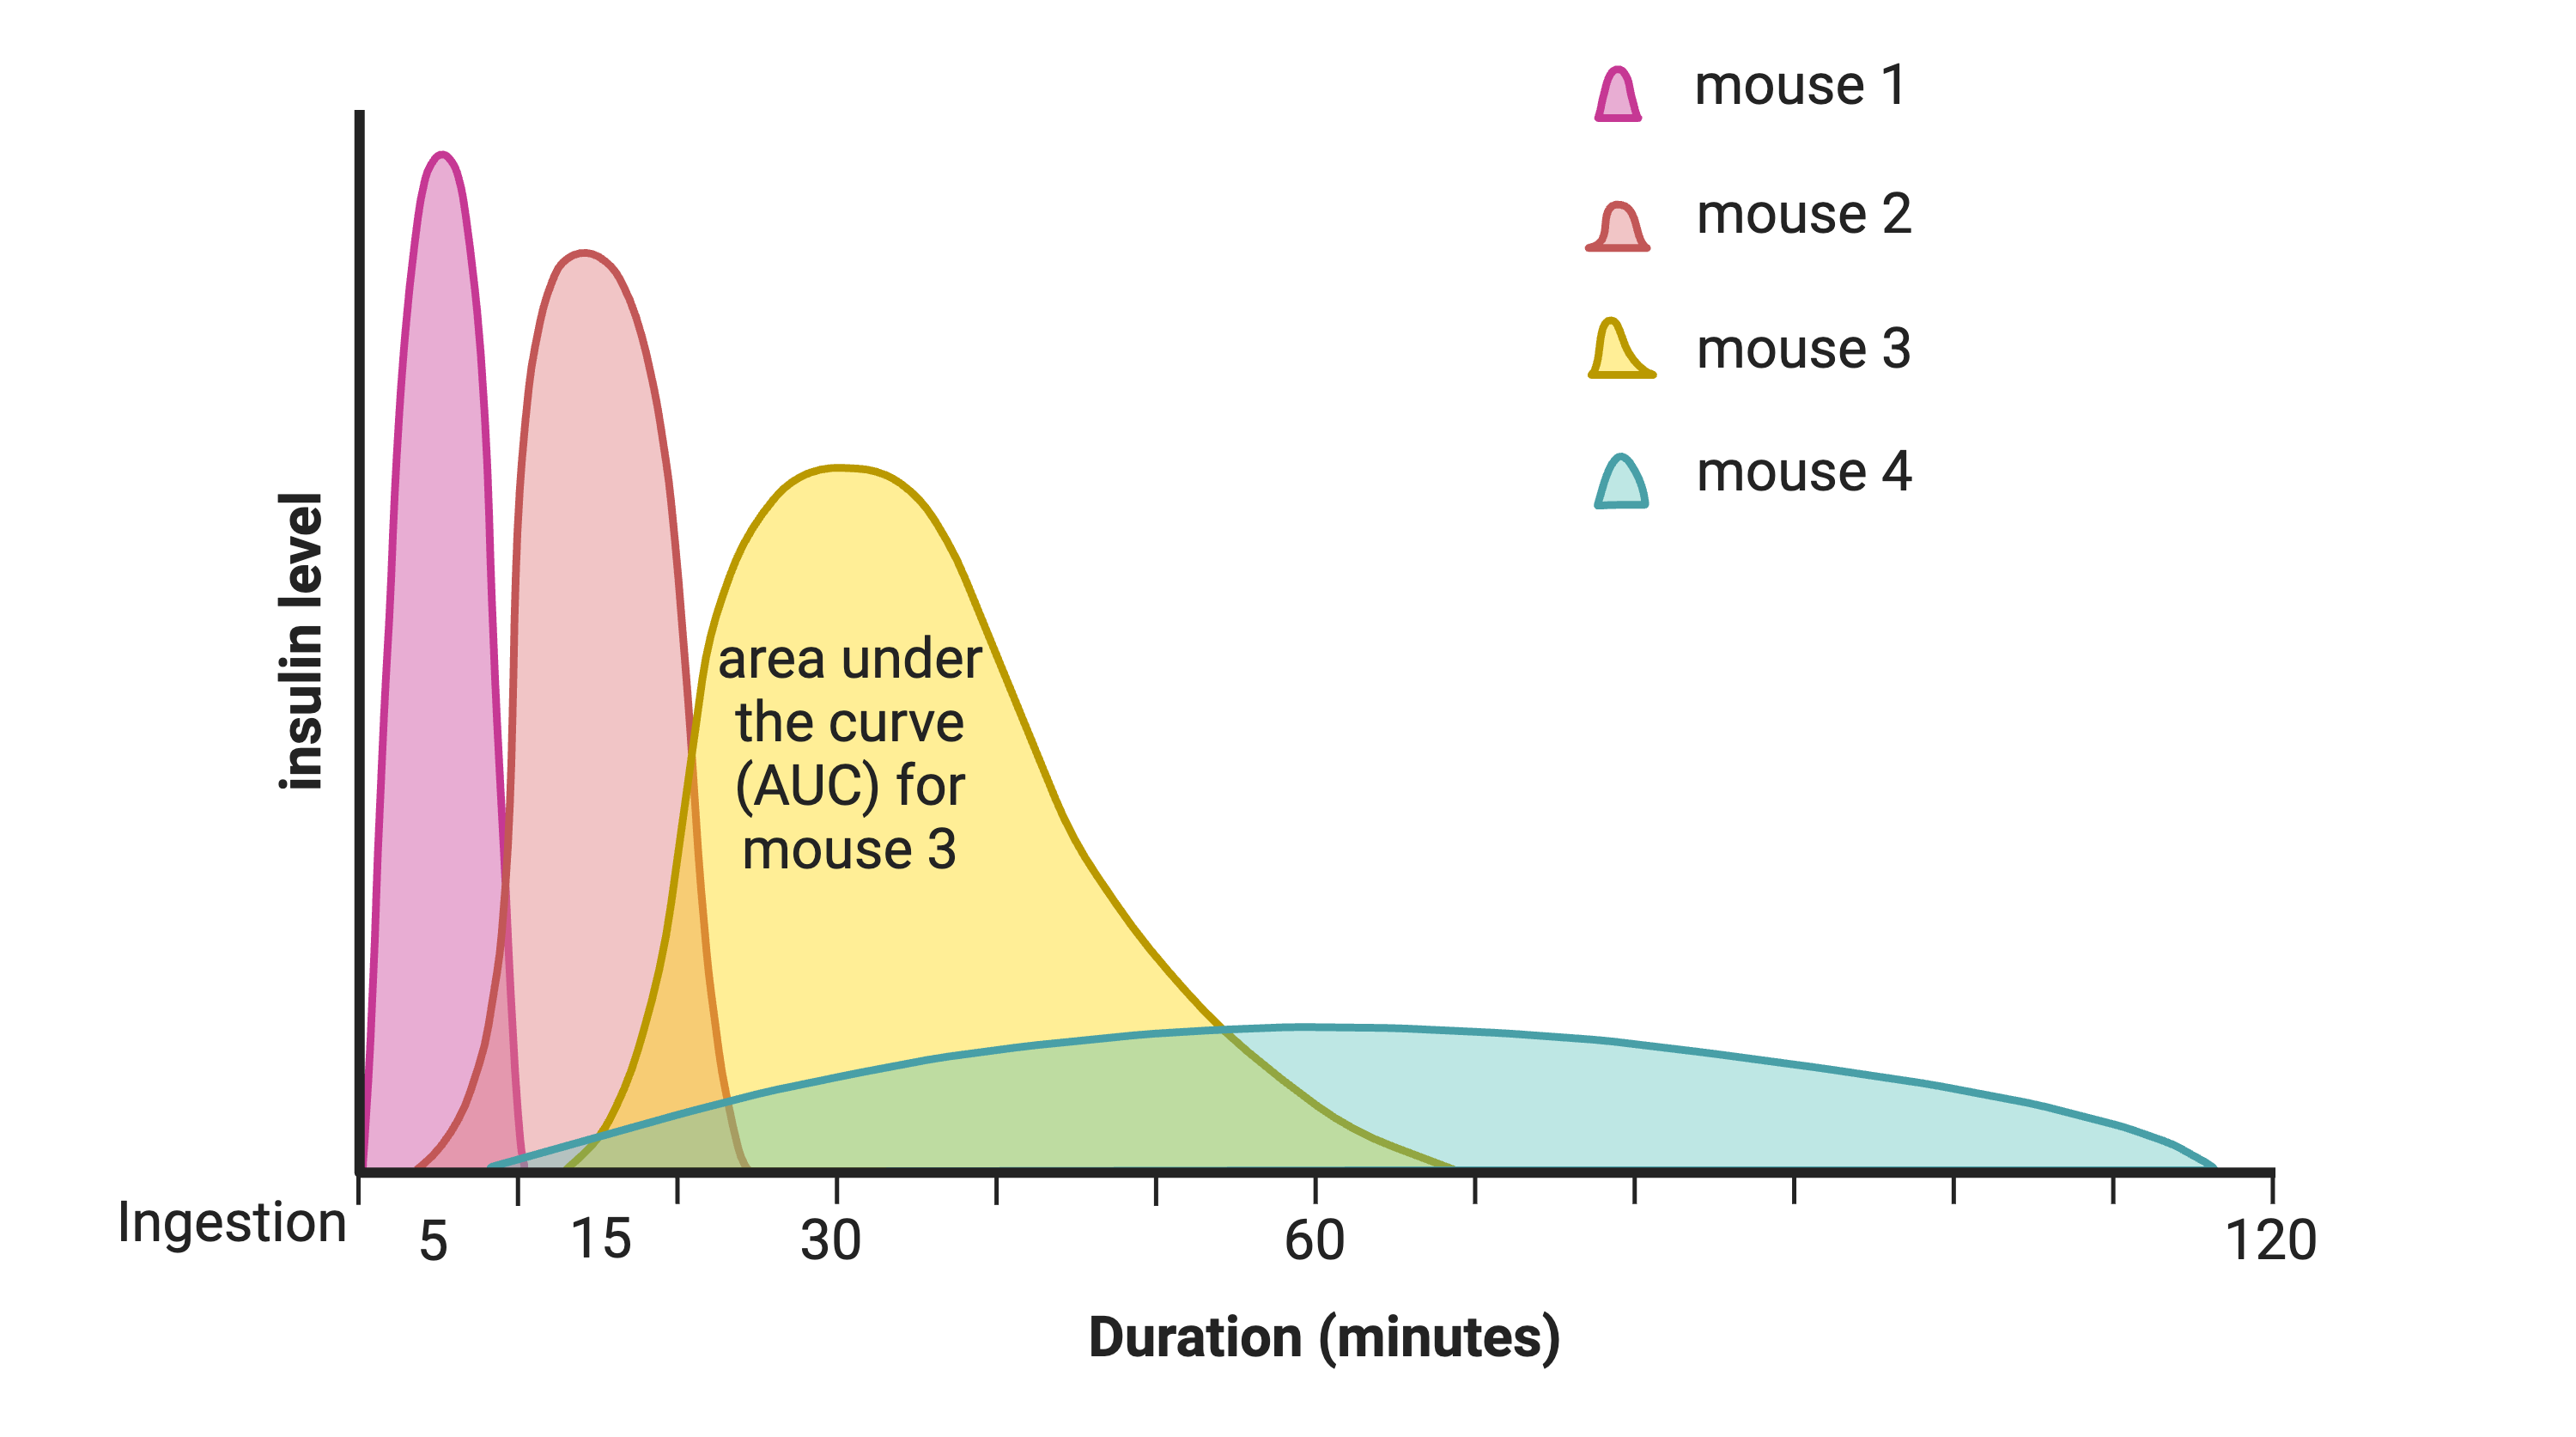
Insulin curves following glucose tolerance
test
Figure 5
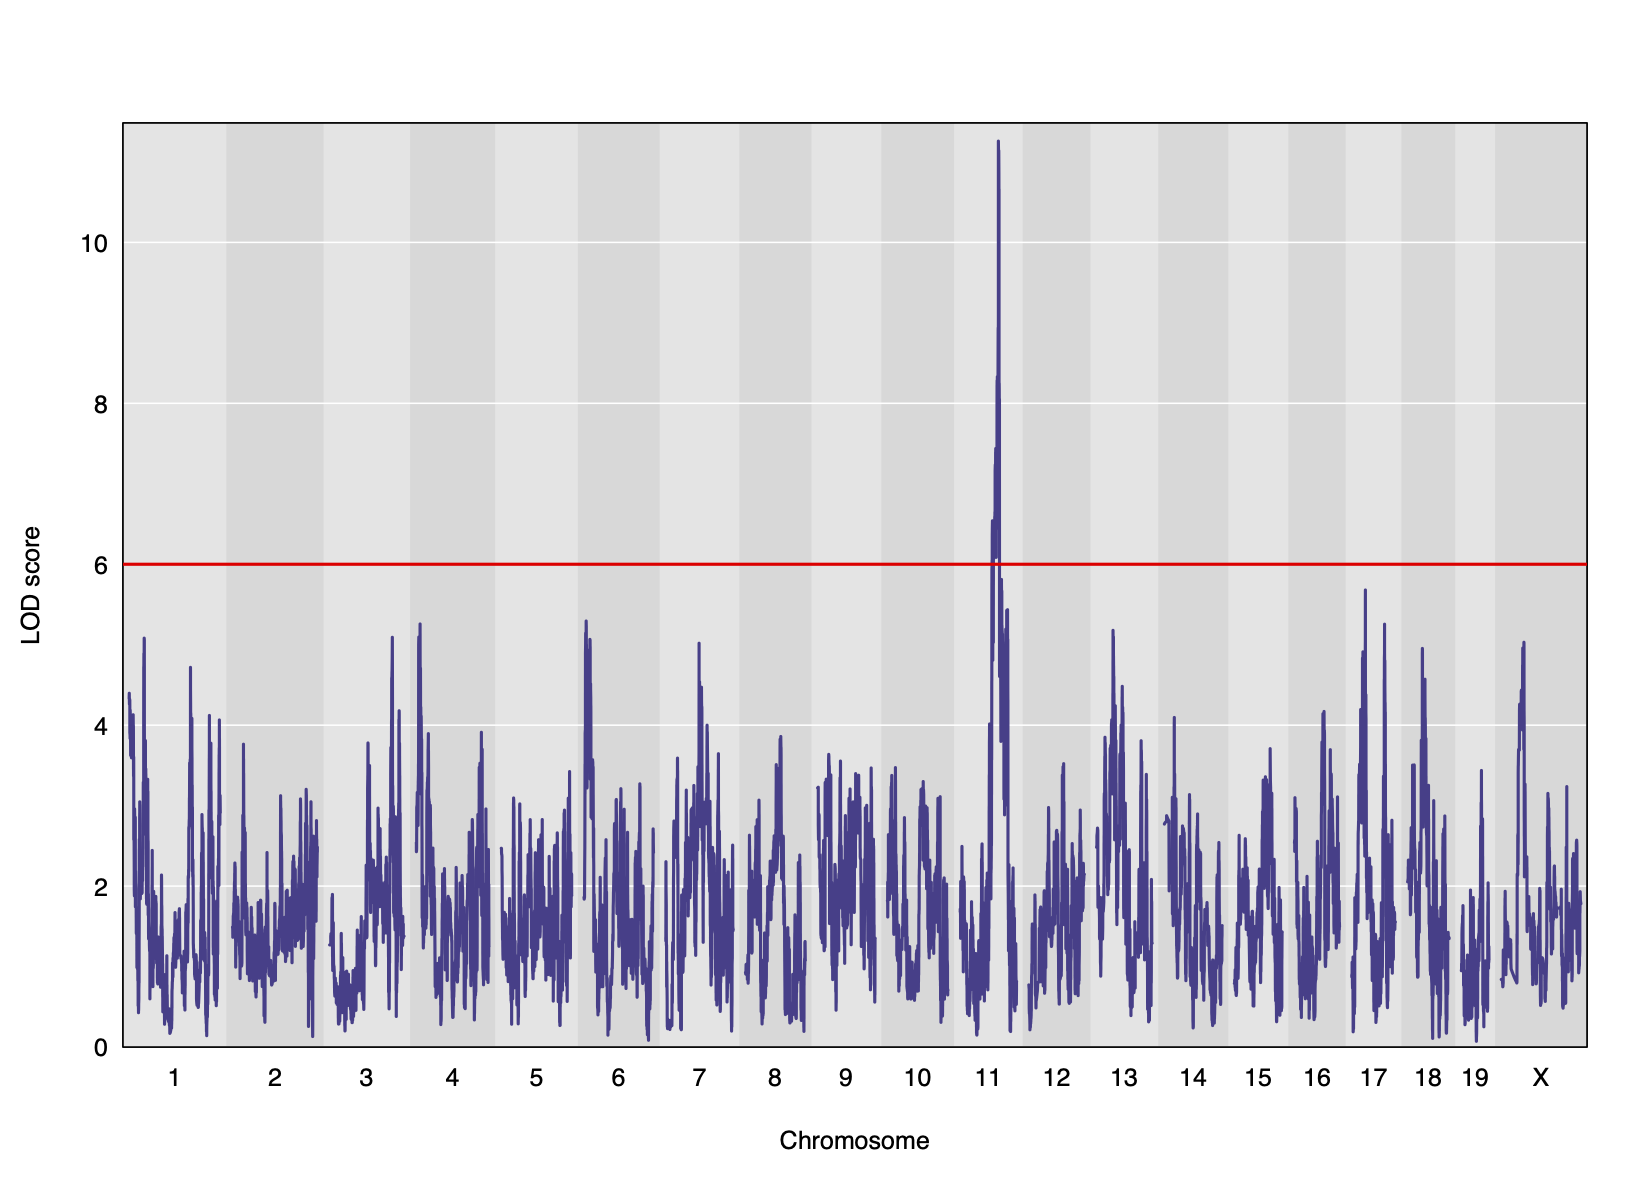
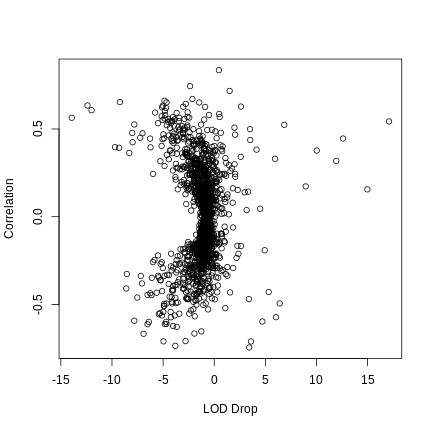
LOD plot for insulin area under the curve
Figure 6
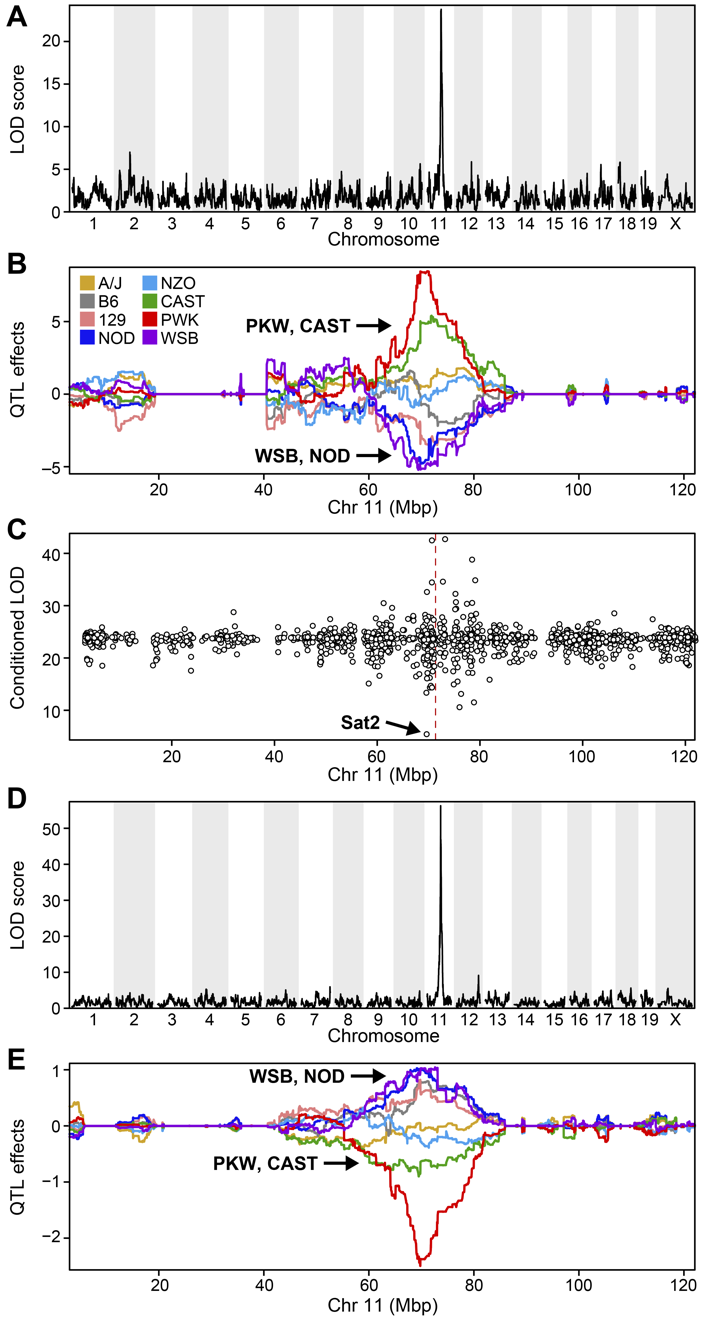
Keller et al, 2018 Supplementary Figure S7
Load and Explore Data
Figure 1
Figure 2
Figure 3
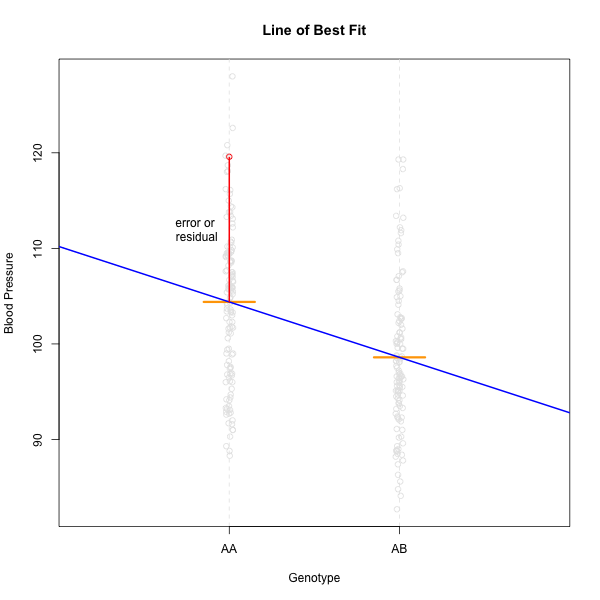
A linear model showing one residual
Figure 4
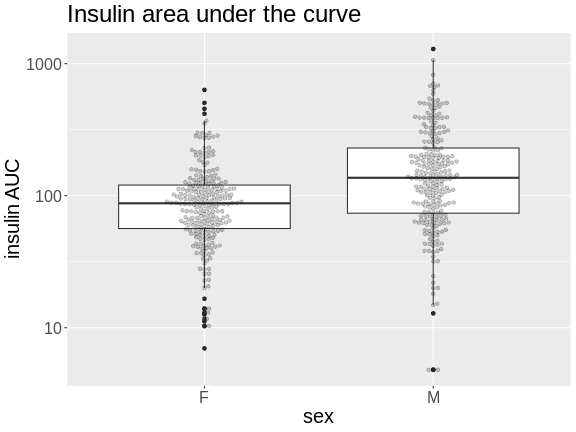
Figure 5
Figure 6
Figure 7
Figure 8
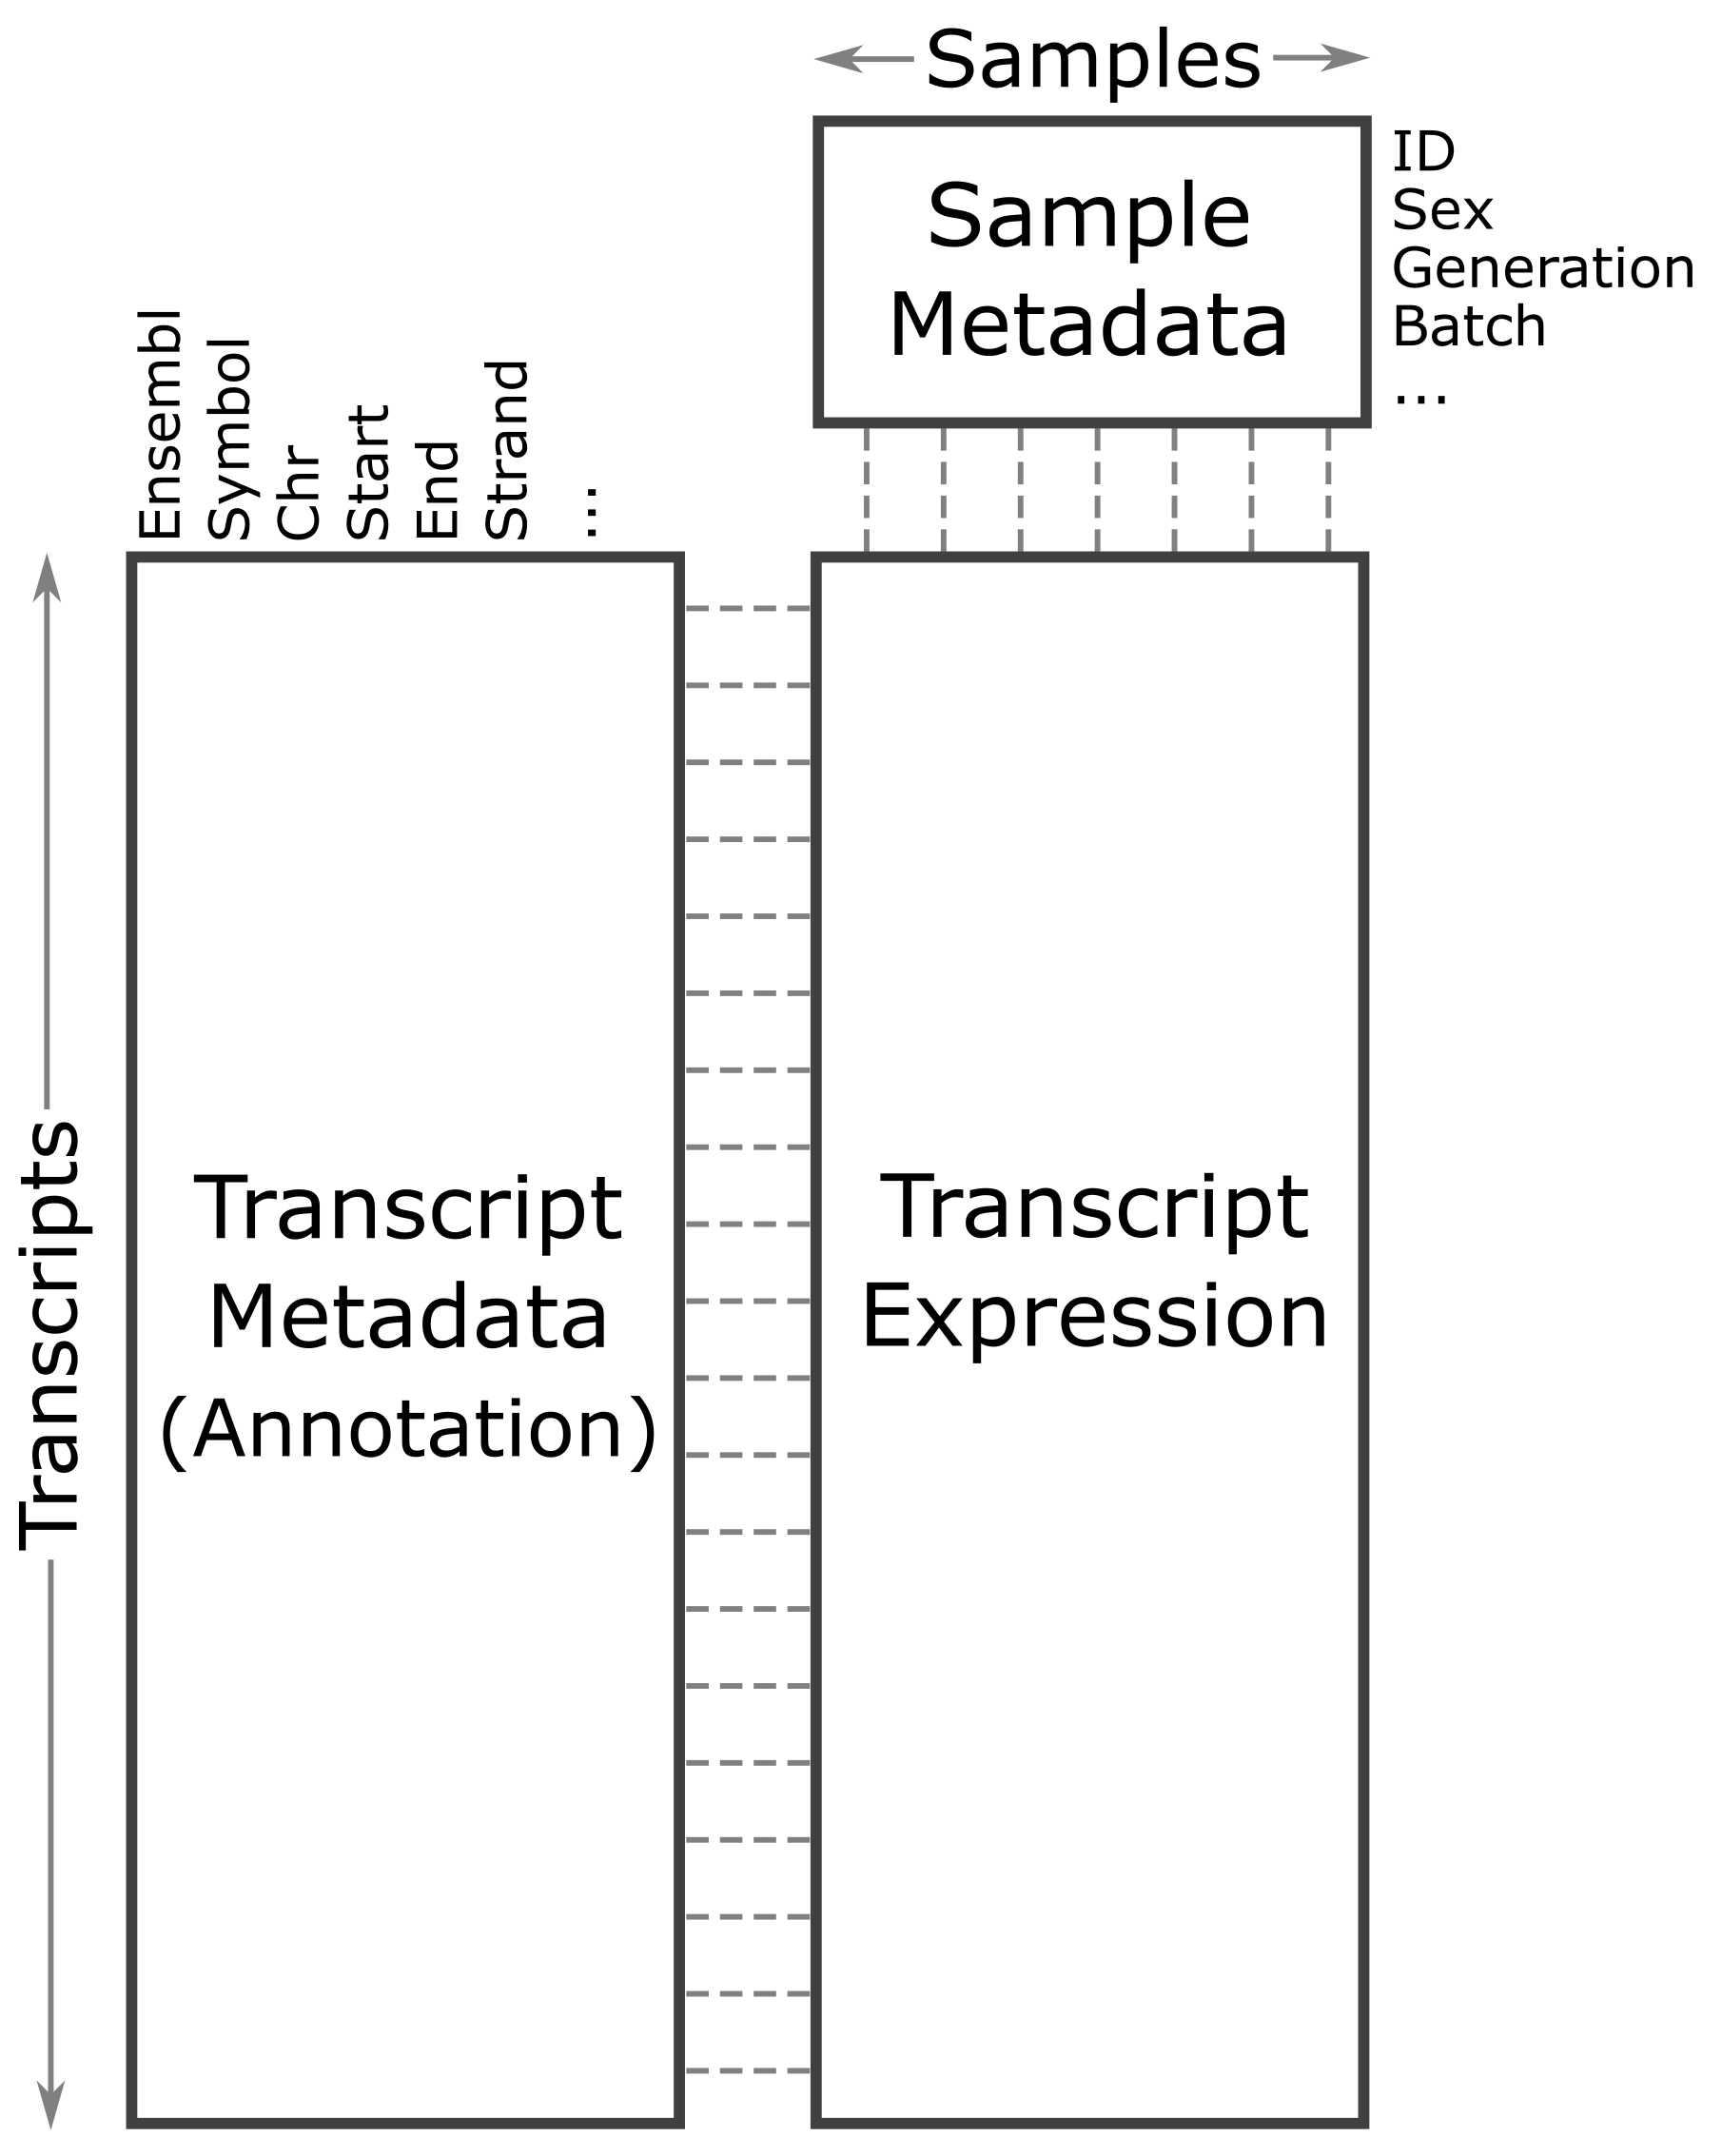
Data Diagram
Figure 9
Figure 10
Mapping A Single Gene Expression Trait
Figure 1
Figure 2
Figure 3
Figure 4
Figure 5
Figure 6
Figure 7
Figure 8
Figure 9
Figure 10
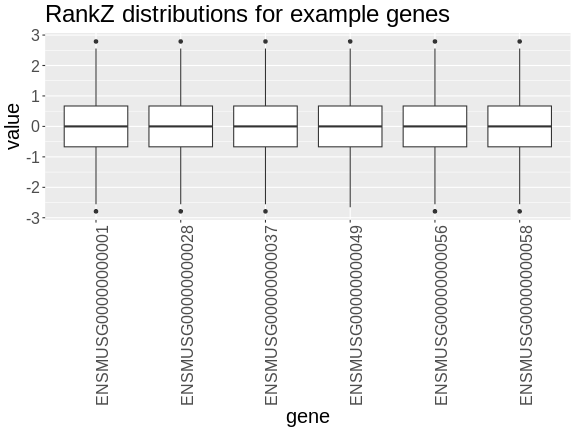
Figure 11
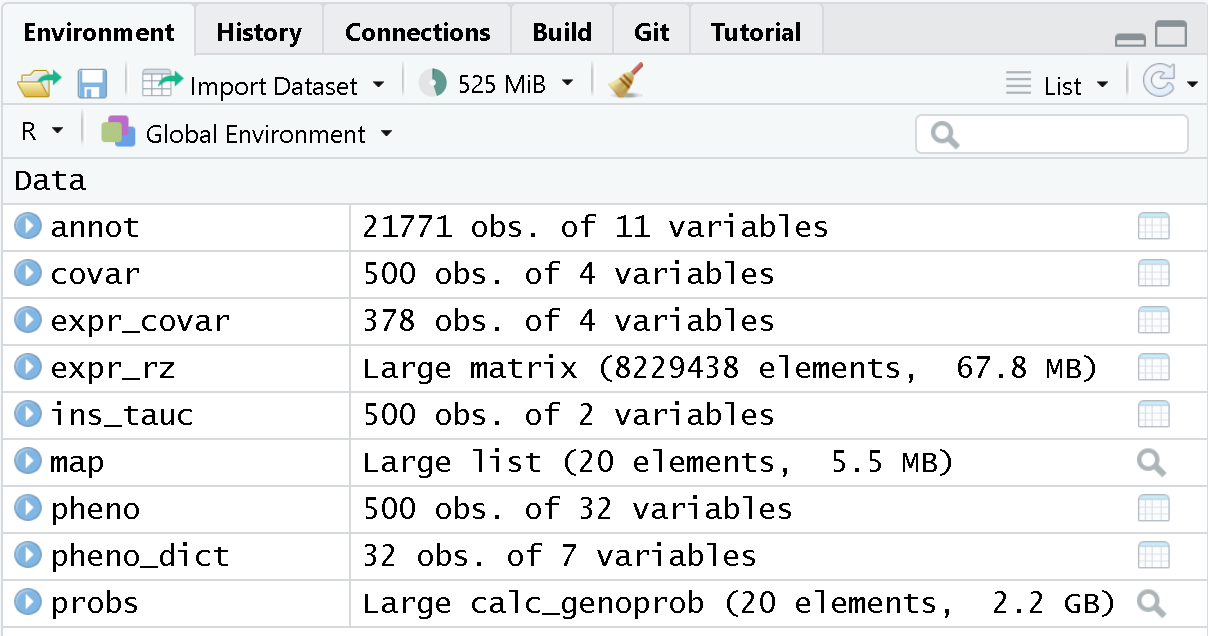 Each element of
probs is a 3-dimensional array containing the founder
allele dosages for each sample at each marker on one chromosome. These
are the 8 state allele probabilities (not 32) using the 69k marker grid
for the same 500 DO mice that also have clinical phenotypes. We have
already calculated genotype probabilities for you, so you can skip the
step for calculating
genotype probabilities and the optional step for calculating allele
probabilities.
Figure 12
Figure 13
Figure 14
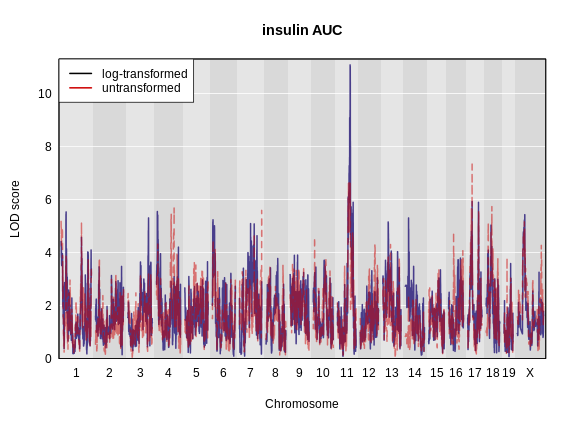
Figure 15
Figure 16
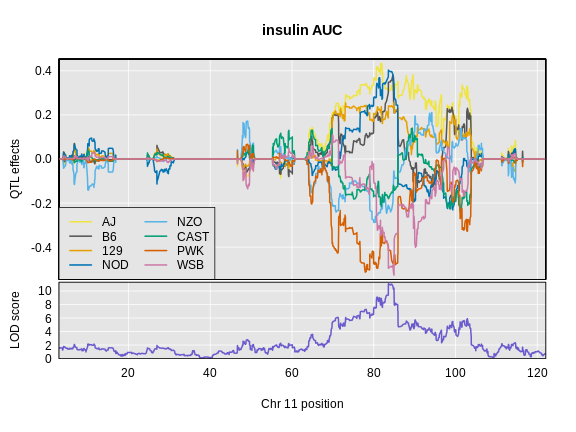
Figure 17
Mapping Many Gene Expression Traits
Figure 1
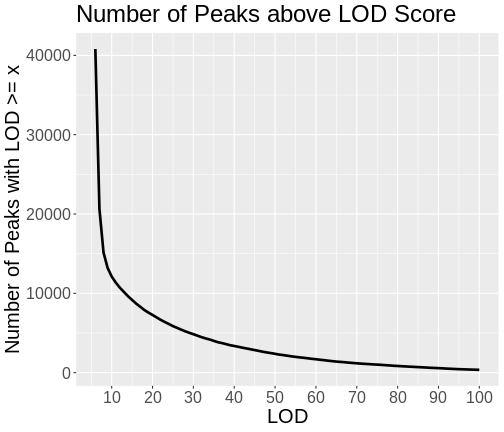
Figure 2
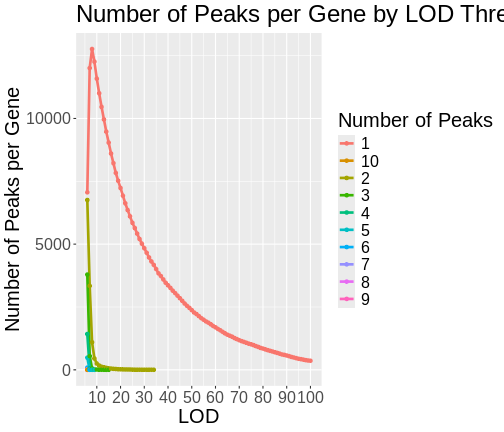
Maximum eQTL Peaks and Nearby Genes
Figure 1
Creating A Transcriptome Map
Figure 1
Figure 2
Figure 3
Figure 4
Figure 5
Figure 6
Figure 7
Figure 8
Figure 9
Figure 10
Mediation Analysis
Figure 1
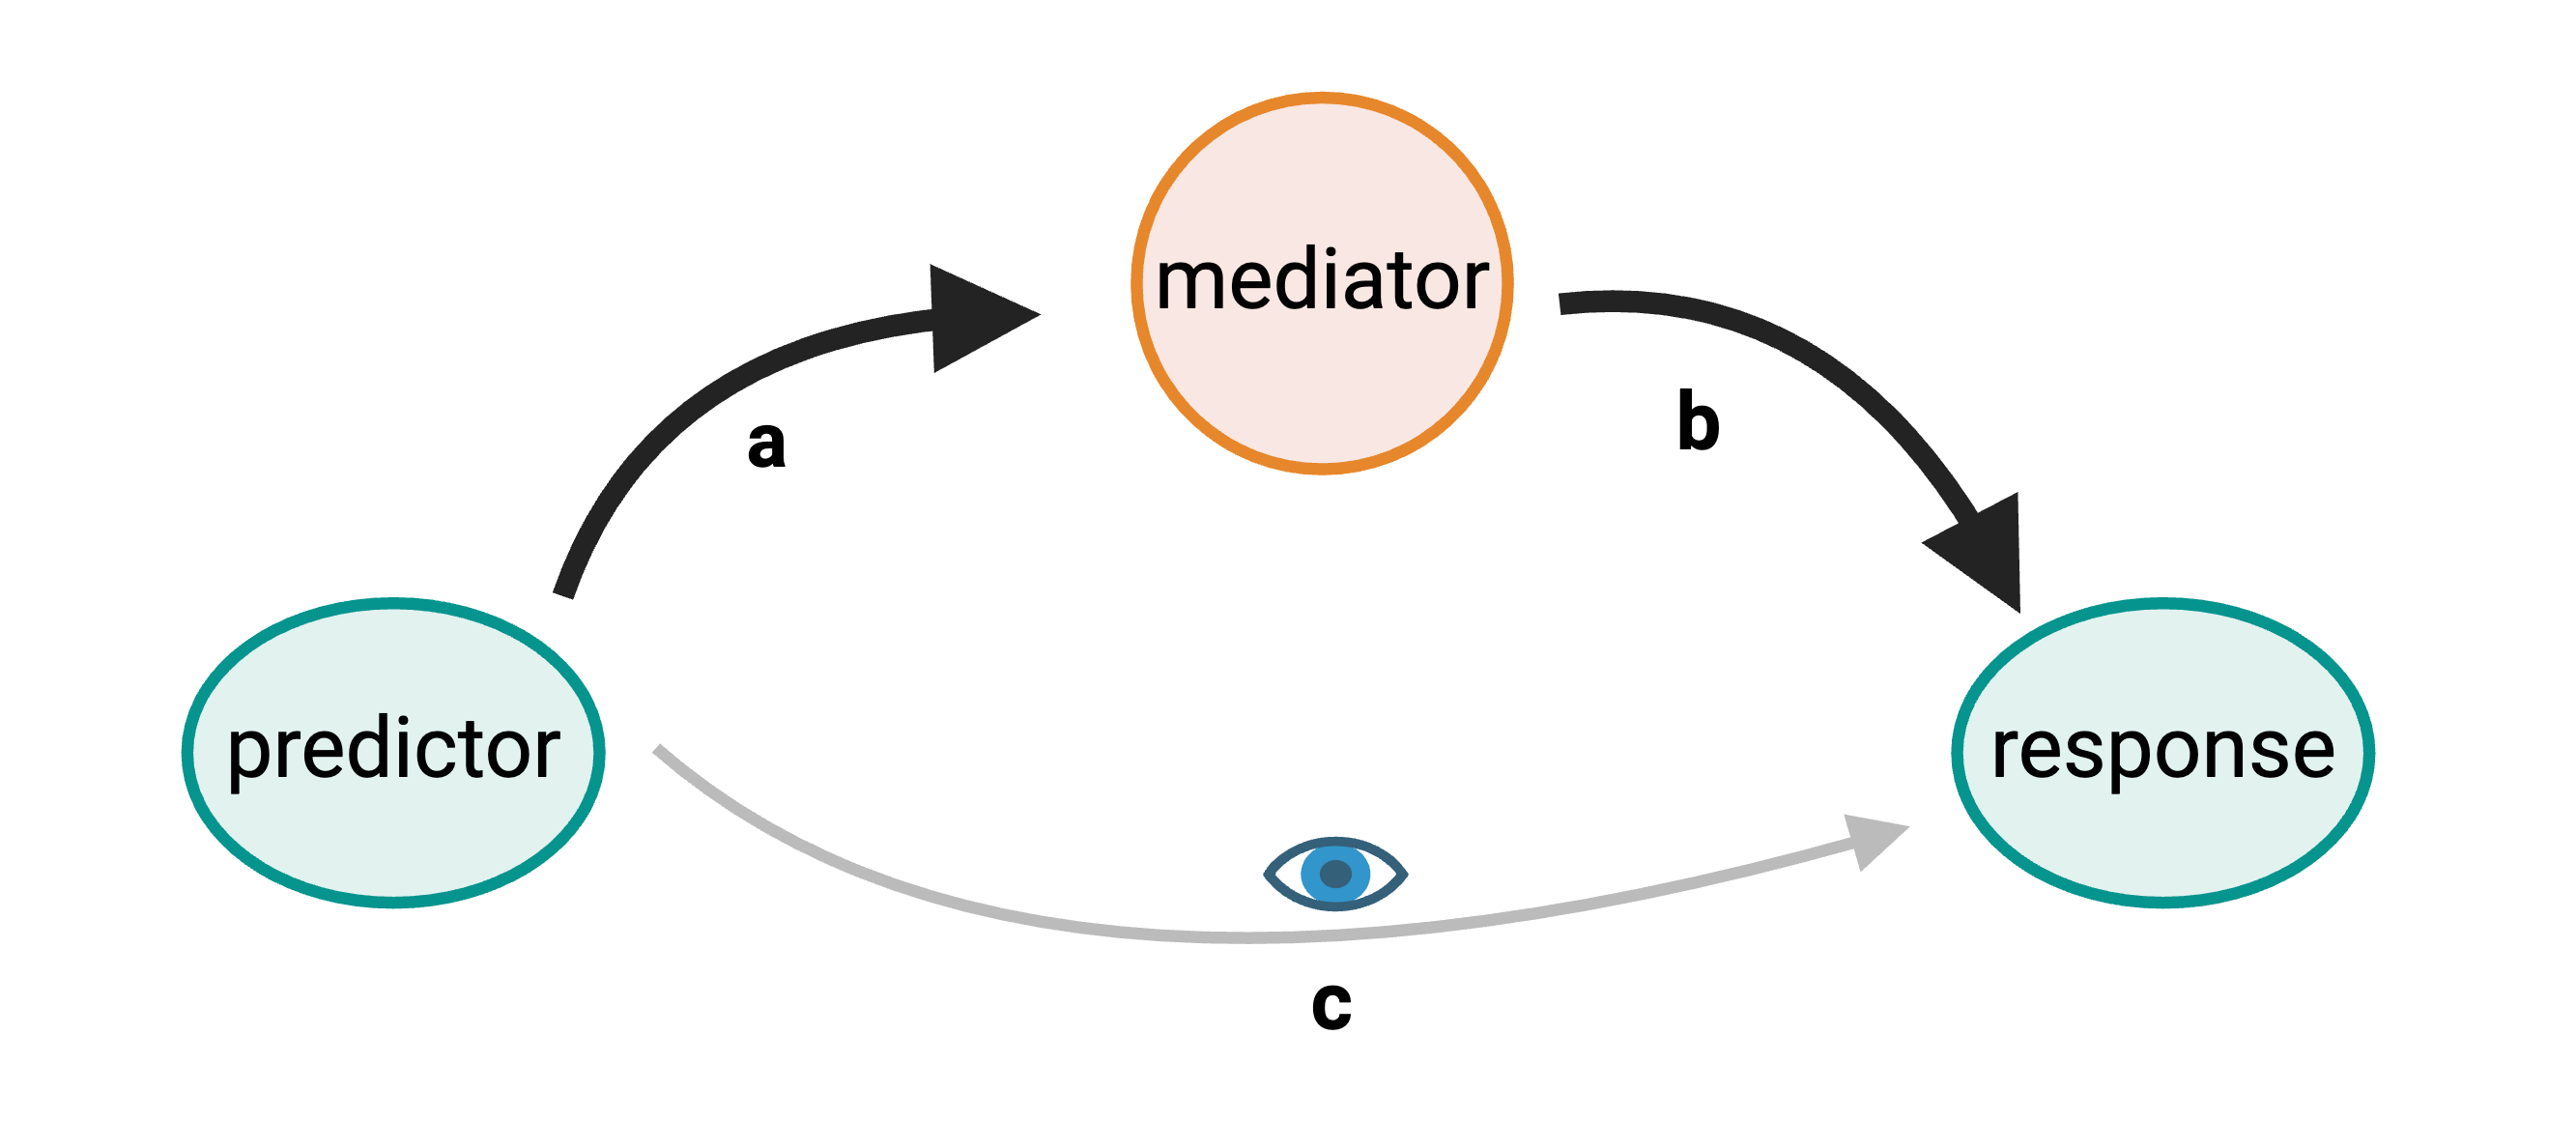
In complete mediation an predictor variable
influences a response variable indirectly through a mediator
variable.
Figure 2
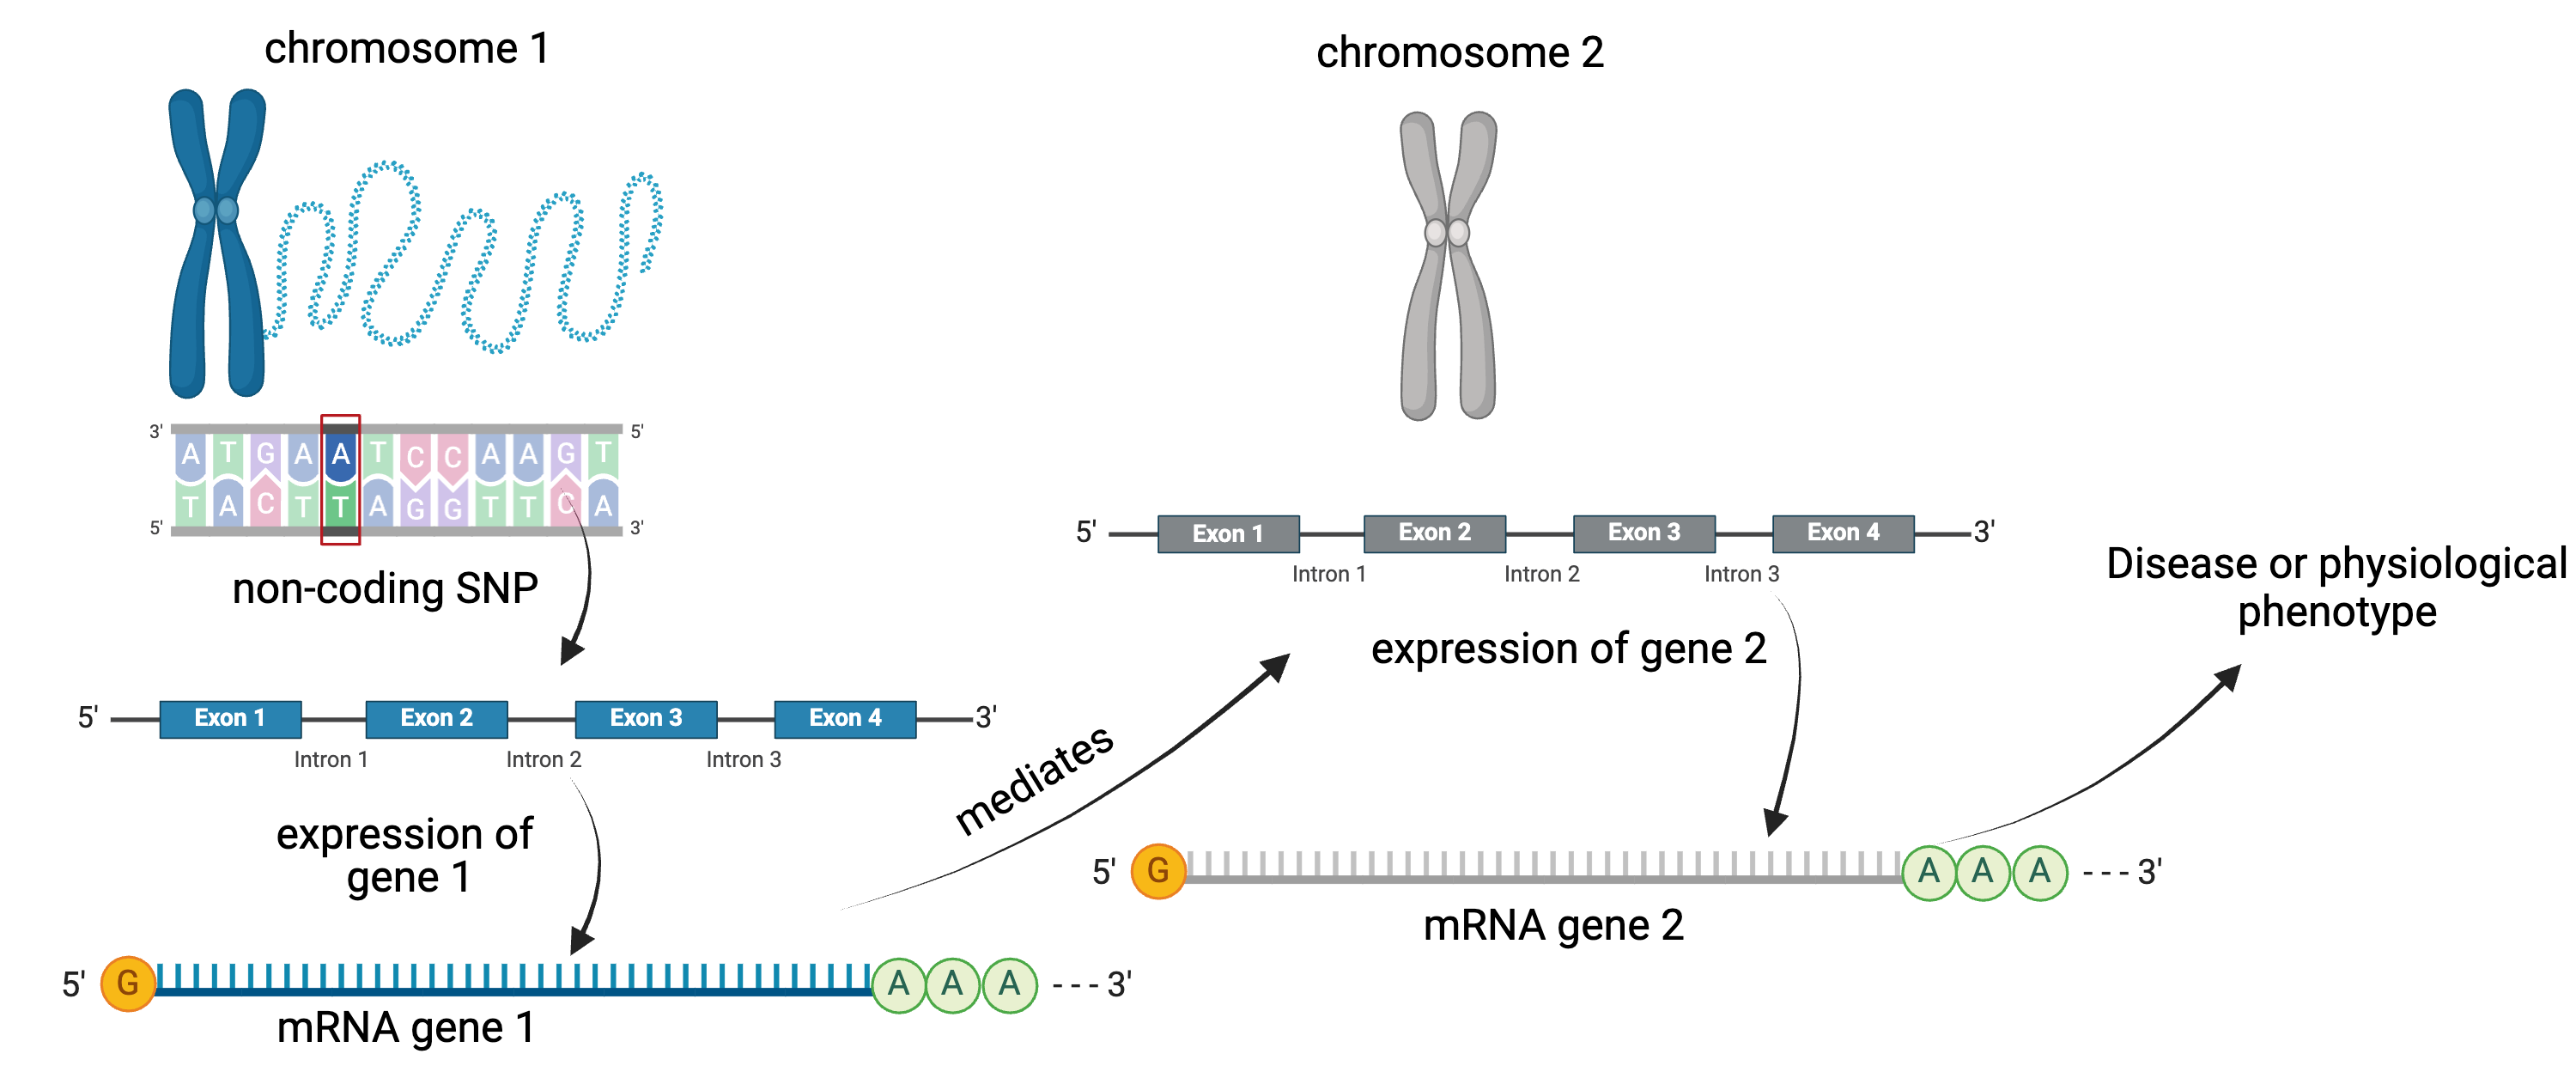
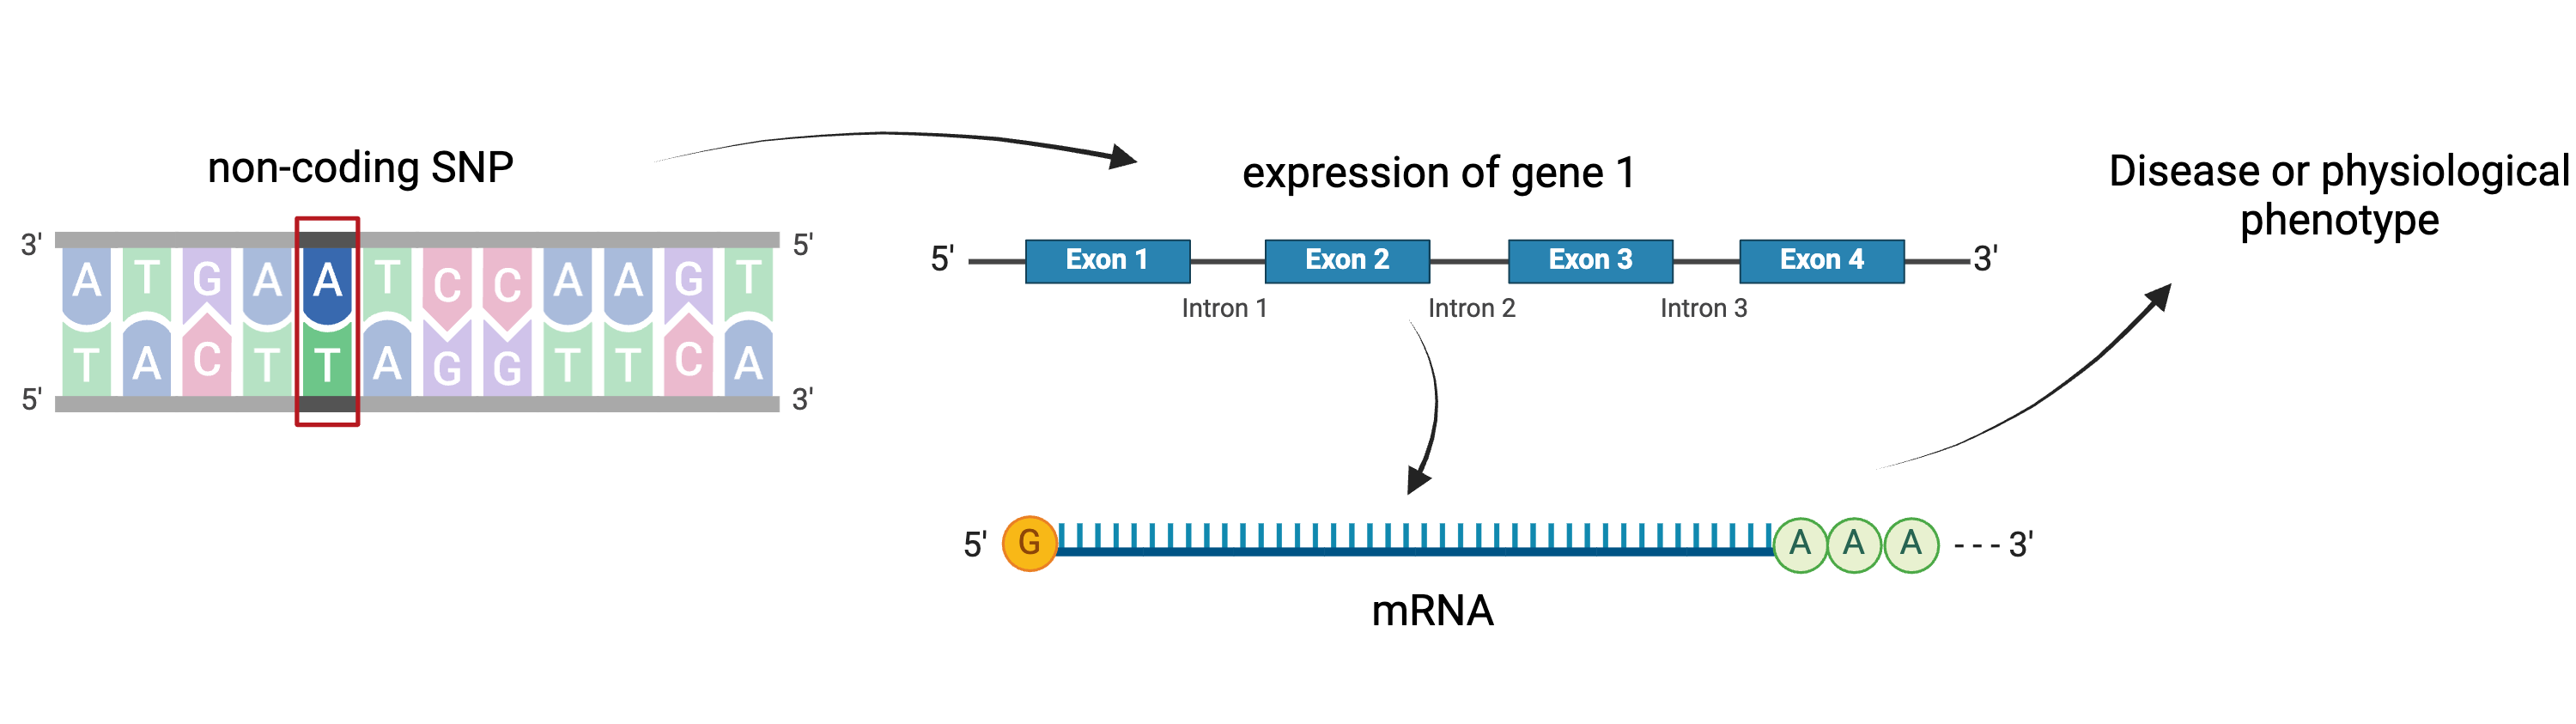
A non-coding SNP affects expression of gene 1
locally. Gene 1 mediates expression of gene 2 distally.
Figure 3
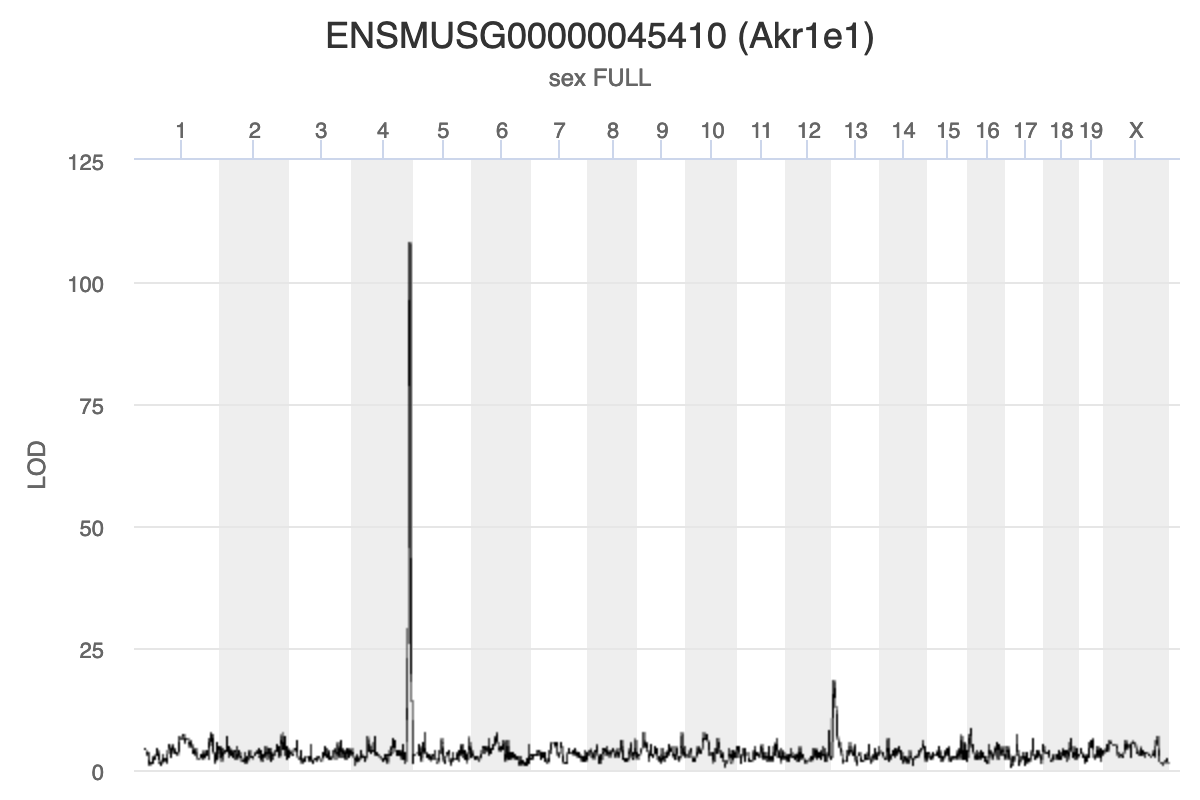
Chromosome 13 gene Akr1e1 is affected by
expression in both local and distant by genes on chromosomes 13 and
4.
Figure 4
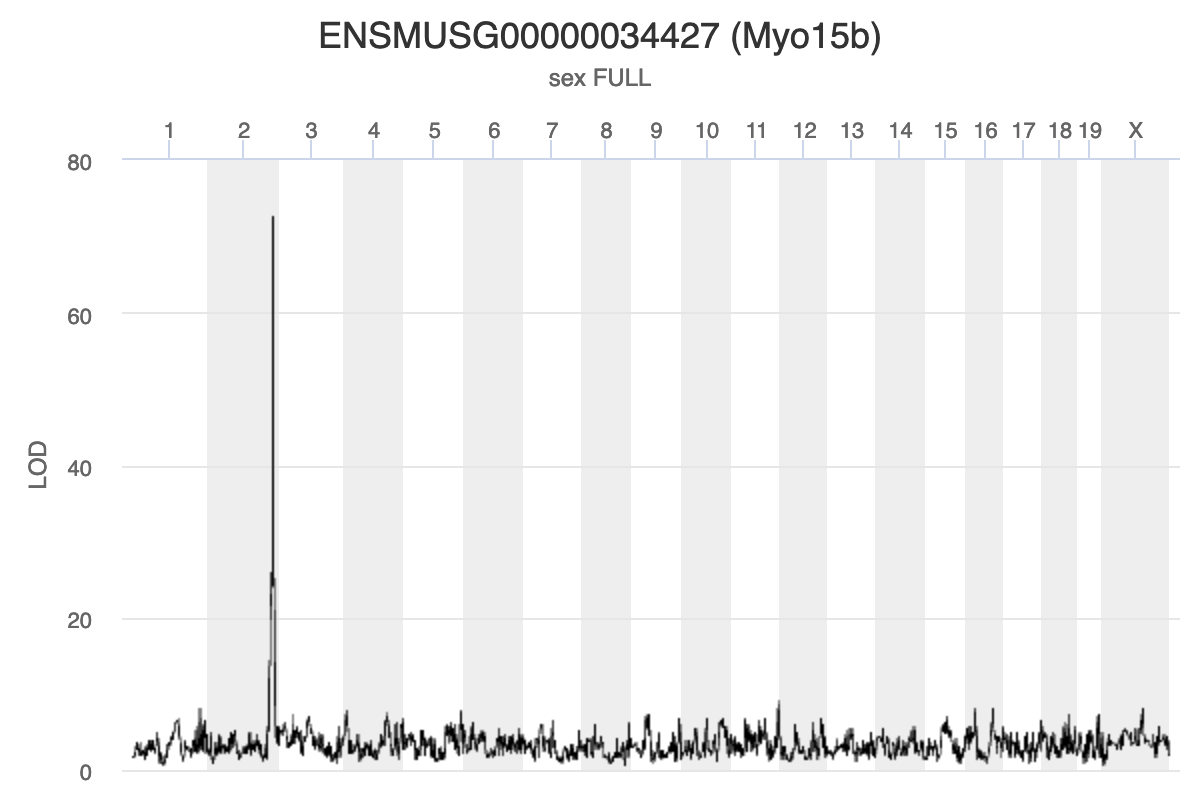
Chromosome 11 gene Myo15b is affected by
expression of a gene in the chromosome 2 hotspot.
Figure 5
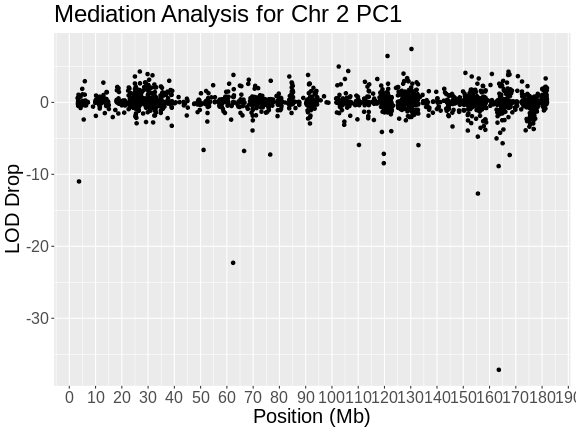
Figure 6
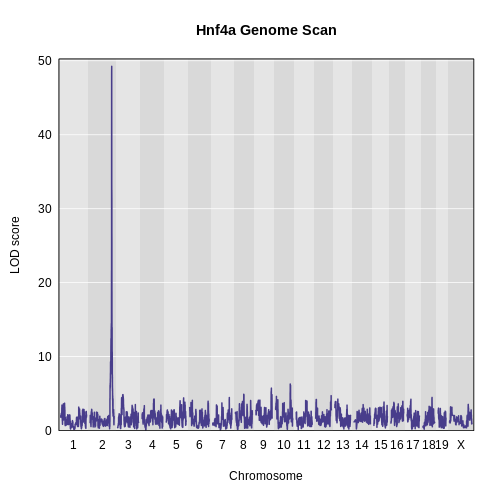
Figure 7
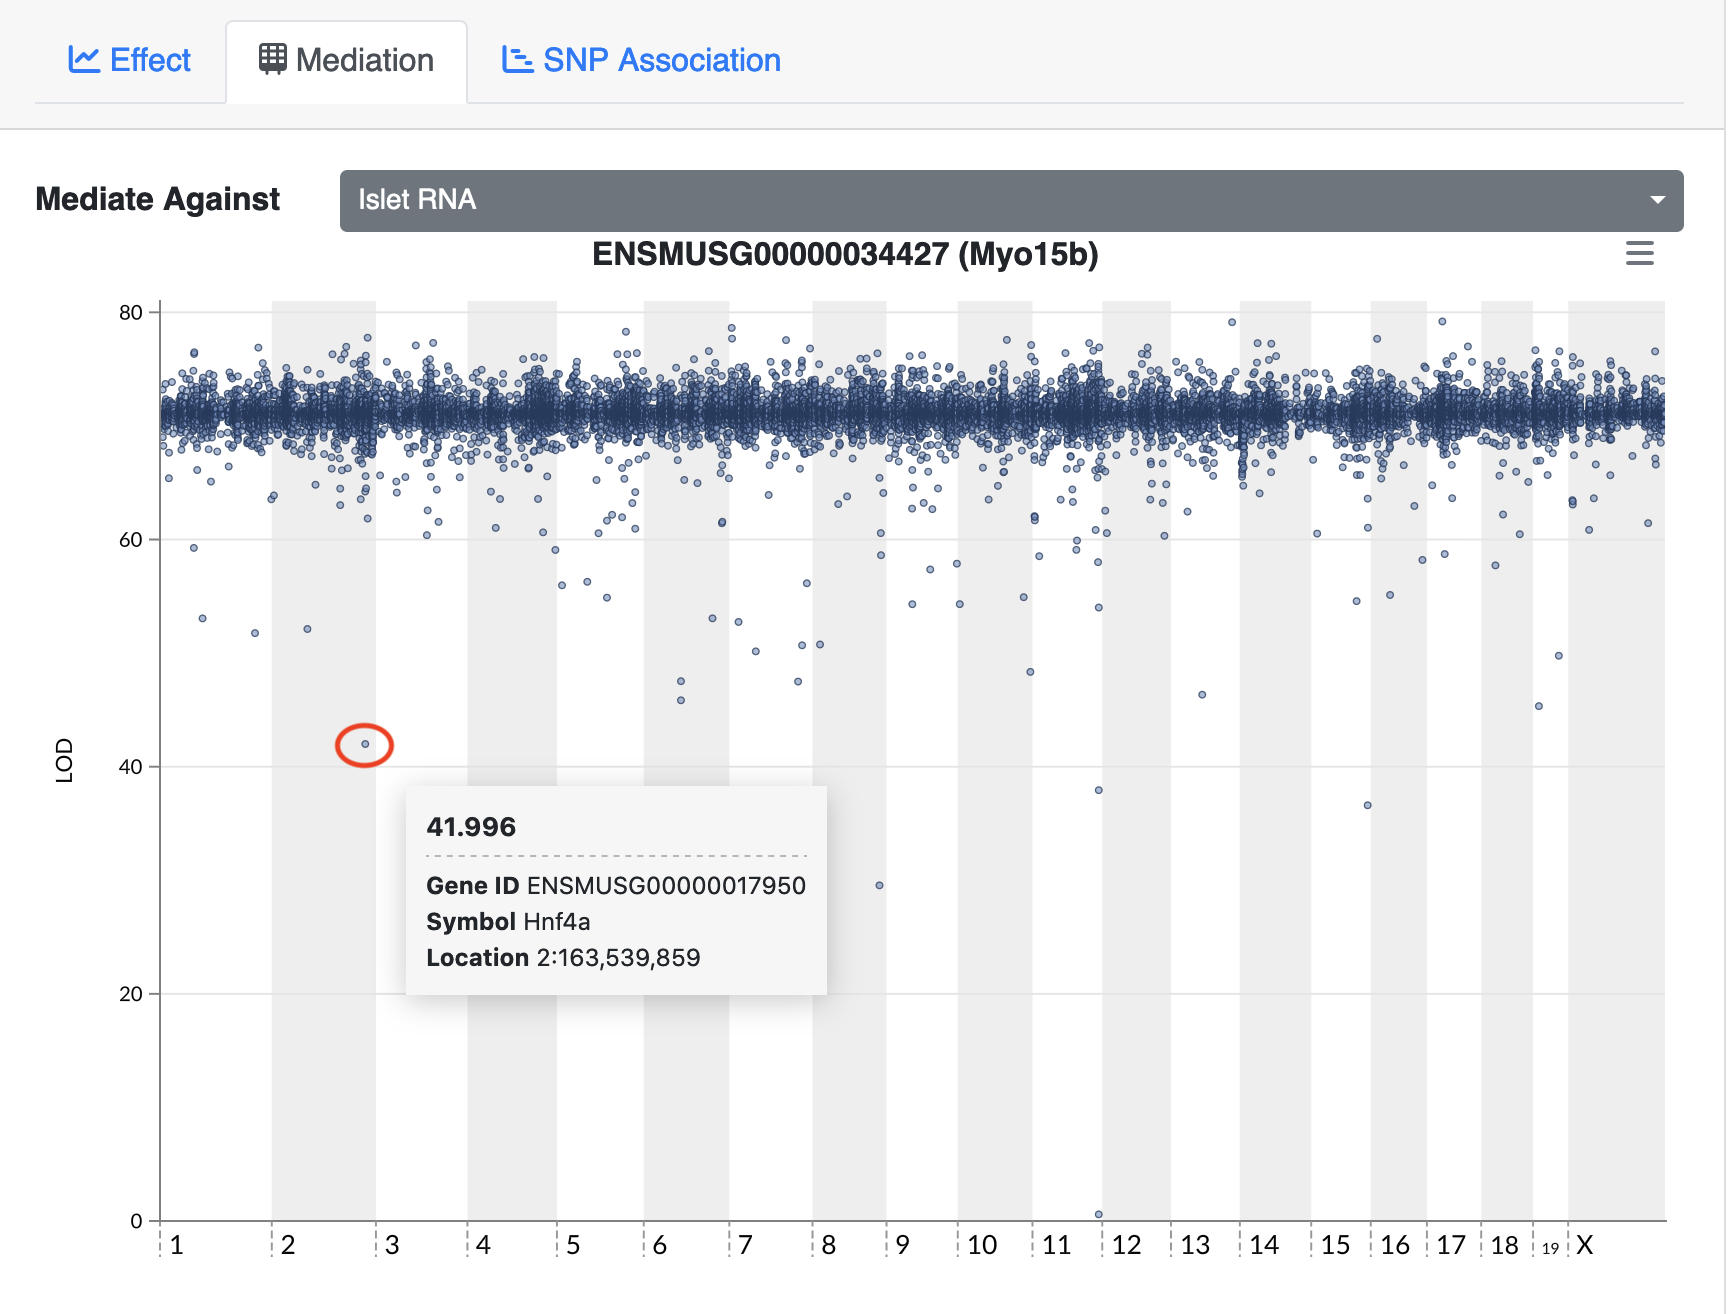
Mediating expression of Myo15b identifies Hnf4a
as the gene that drops the LOD score from greater than 70 to less than
50.
Figure 8
Figure 9
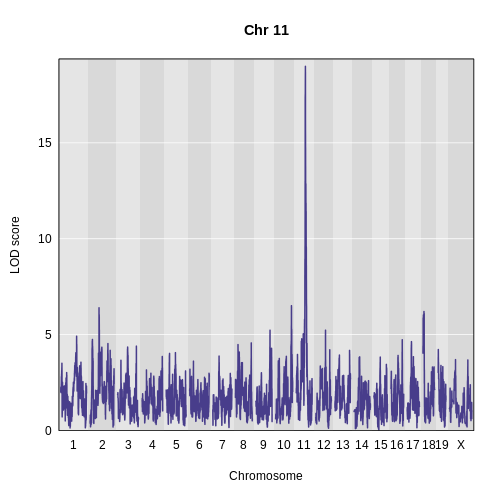
Figure 10
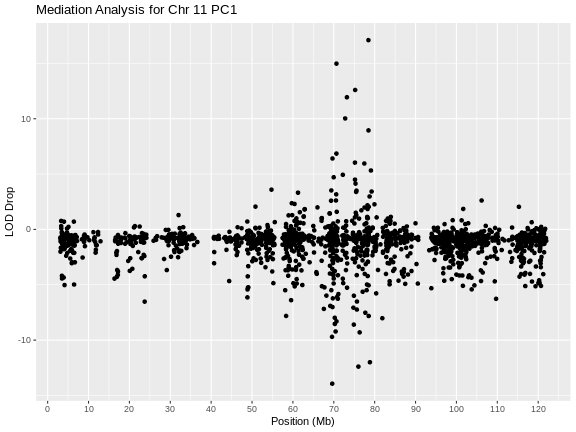
Figure 11
Figure 12
Figure 13
Figure 14