Interpreting qtl2 results
Last updated on 2024-12-10 | Edit this page
Estimated time: 30 minutes
Overview
Questions
- How do I interpret qtl2 results?
Objectives
- Interpret the relationship between sequence, expression and phenotype variation from qtl2 mapping results.

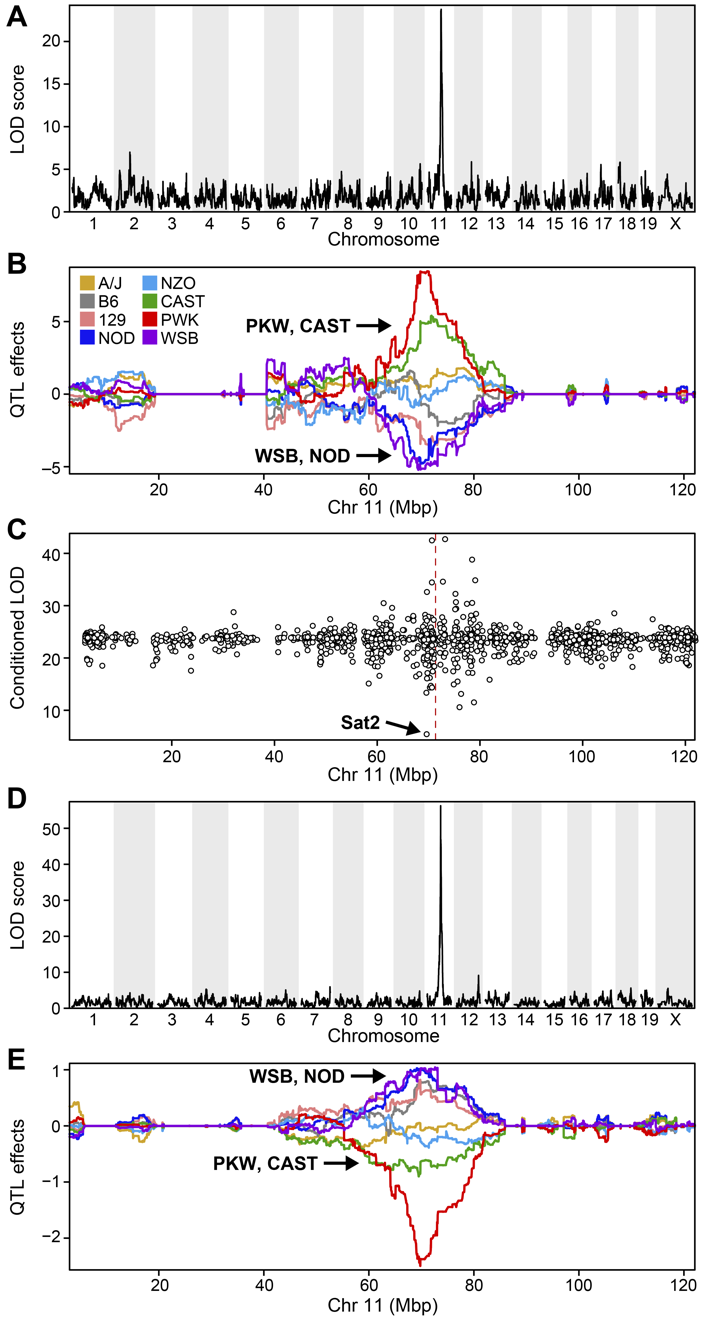
Attie et al, 2018 Supplementary Figure S7
Challenge: Interpreting qtl2 results
Refer to the figure above.
1). What does panel A show? What conclusions could you draw from
panel A?
2). What does panel B show? What conclusions could you draw from panel
B?
3). What does panel C show? What conclusions could you draw from panel
C?
4). How are panels A through C related to one another? What story do
they tell together?
Key Points
- Use
.mdfiles for episodes when you want static content
