Finding QTL peaks
Last updated on 2025-10-07 | Edit this page
Overview
Questions
- How do I locate QTL peaks above a certain LOD threshold value?
Objectives
- Locate QTL peaks above a LOD threshold value throughout the genome.
- Identify the Bayesian credible interval for a QTL peak.
Once we have LOD scores from a genome scan and a significance threshold, we can look for QTL peaks associated with the phenotype. High LOD scores indicate the neighborhood of a QTL but don’t give its precise position. To find the exact position of a QTL, we define an interval that is likely to hold the QTL.
We’ll use the Bayesian credible interval, which is a method for defining QTL intervals. It describes the probability that the interval contains the true value. Credible intervals make a probabilistic statement about the true value, for example, a 95% credible interval states that there is a 95% chance that the true value lies within the interval.
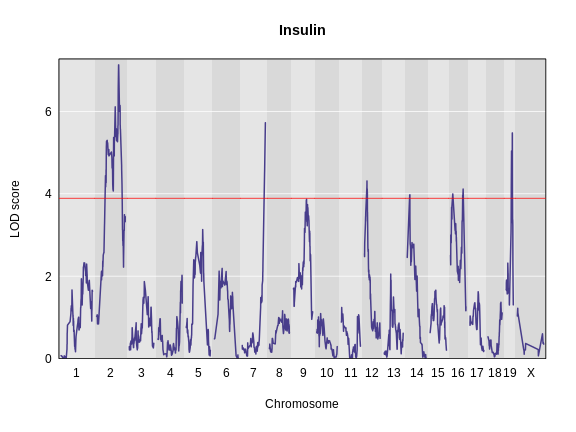
Let’s remind ourselves how the genome scan for insulin looks.
R
thr <- summary(perm_add_loco)

plot_scan1(x    = lod_add_loco,
           map  = cross$pmap,
           main = "Insulin")
add_threshold(map        = cross$pmap,
              thresholdA = thr,
              col        = 'red')
To find peaks above a given threshold LOD value, use the function
find_peaks(). It can also provide Bayesian credible
intervals by using the argument prob (the nominal coverage
for the Bayes credible intervals). Set the argument
expand2markers = FALSE to keep from expanding the interval
out to genotyped markers, or exclude this argument if you’d like to
include flanking markers.
You need to provide both the scan1() output, the marker
map and a threshold. We will use the 95% threshold from the permutations
in the previous lesson.
R
find_peaks(scan1_output = lod_add_loco,
           map          = cross$pmap,
           threshold    = thr,
           prob         = 0.95,
           expand2markers = FALSE)
OUTPUT
  lodindex          lodcolumn chr       pos      lod      ci_lo     ci_hi
1        1 log10_insulin_10wk   2 138.94475 7.127351  64.949395 149.57739
2        1 log10_insulin_10wk   7 144.18230 5.724018 139.368290 144.18230
3        1 log10_insulin_10wk  12  25.14494 4.310493  15.834815  29.05053
4        1 log10_insulin_10wk  14  22.24292 3.974322   6.241951  45.93876
5        1 log10_insulin_10wk  16  80.37433 4.114024  10.238134  80.37433
6        1 log10_insulin_10wk  19  54.83012 5.476587  48.370980  55.15007
In the table above, we have one peak per chromosome because that is
the default behavior of find_peaks(). The
find_peaks() function can also pick out multiple peaks on a
chromosome: each peak must exceed the chosen threshold, and the argument
peakdrop indicates the amount that the LOD curve must drop
between the lowest of two adjacent peaks. Use this feature with
caution.
R
find_peaks(scan1_output = lod_add_loco,
           map          = cross$pmap,
           threshold    = thr,
           peakdrop     = 1.8,
           prob         = 0.95,
           expand2markers = FALSE)
OUTPUT
  lodindex          lodcolumn chr       pos      lod      ci_lo     ci_hi
1        1 log10_insulin_10wk   2 138.94475 7.127351  64.949395 149.57739
2        1 log10_insulin_10wk   7 144.18230 5.724018 139.368290 144.18230
3        1 log10_insulin_10wk  12  25.14494 4.310493  15.834815  29.05053
4        1 log10_insulin_10wk  14  22.24292 3.974322   6.241951  45.93876
5        1 log10_insulin_10wk  16  17.48123 3.995627   5.604167  37.99110
6        1 log10_insulin_10wk  16  80.37433 4.114024  74.250773  80.37433
7        1 log10_insulin_10wk  19  54.83012 5.476587  48.370980  55.15007
Each row shows a different peak; the columns show the peak location, LOD score and the lower and upper interval endpoints. Note that we now have two peaks on chromosome 16, one at 17.5 Mb and one at 80.4 Mb.
Challenge 1
Find peaks in the genome scan object called lod_add_loco
that meet a threshold of 3 and are in the interval described by a 2
point LOD drop from the peak. How many peaks meet the LOD threshold of 3
and lie within the interval defined by a 2 point LOD drop from the
maximum peaks on each chromosome?
R
find_peaks(scan1_output = lod_add_loco,
           map          = cross$pmap,
           threshold    = 3,
           drop         = 2)
OUTPUT
  lodindex          lodcolumn chr       pos      lod      ci_lo     ci_hi
1        1 log10_insulin_10wk   2 138.94475 7.127351  63.943187 156.83772
2        1 log10_insulin_10wk   5 103.41486 3.130862  41.967549 132.28428
3        1 log10_insulin_10wk   7 144.18230 5.724018 129.414016 144.18230
4        1 log10_insulin_10wk   9  83.67606 3.865635  17.504307 111.02206
5        1 log10_insulin_10wk  12  25.14494 4.310493   9.998200  34.23274
6        1 log10_insulin_10wk  14  22.24292 3.974322   6.241951  68.04655
7        1 log10_insulin_10wk  16  80.37433 4.114024   3.804882  96.52406
8        1 log10_insulin_10wk  19  54.83012 5.476587  47.361847  56.37100
This produces 8 peaks on 8 different chromosomes that meet a LOD threshold of 3 and are within the interval defined by a 2-LOD drop from the maximum peak on each chromosome.
Challenge 2
1). Calculate the 90% Bayes credible interval. For chromosome 2, what
is the range of the interval that has a 90% chance of containing the
true QTL position?
2). Compare with the 95% Bayes credible interval calculated earlier. How
does the interval change as you increase the probability? Why?
1). This produces a range from 118.0 to 149.6 Mb.
R
pks = find_peaks(scan1_output = lod_add_loco,
                 map          = cross$pmap,
                 prob         = 0.90,
                 expand2markers = FALSE)
subset(pks, chr == '2')
OUTPUT
  lodindex          lodcolumn chr      pos      lod    ci_lo    ci_hi
1        1 log10_insulin_10wk   2 138.9448 7.127351 117.9557 149.5774
2). This produces a range from 64.9 to 149.6 Mb, which is much broader than the 90% interval. The interval widens because the probability that the interval contains the true QTL position has increased.
R
pks = find_peaks(scan1_output = lod_add_loco,
                 map          = cross$pmap,
                 prob         = 0.95,
                 expand2markers = FALSE)
subset(pks, chr == '2')
OUTPUT
  lodindex          lodcolumn chr      pos      lod    ci_lo    ci_hi
1 1 log10_insulin_10wk 2 138.9448 7.127351 64.94939 149.5774- LOD peaks and support intervals can be identified with
find_peaks(). - The Bayesian Credible Interval estimates the width of the support interval around a QTL peak.
- Using a higher
probvalue for the Bayesian Credible Interval results in a wider support interval.