Finding Significant Peaks via Permutation
Last updated on 2025-09-30 | Edit this page
Overview
Questions
- How can I evaluate the statistical significance of genome scan results?
Objectives
- Run a permutation test to establish LOD score thresholds.
Using Permutations to Determine Significance Thresholds
To establish the statistical significance of the results of a genome scan, a permutation test can identify the maximum LOD score that can occur by random chance. A permutation tests shuffles genotypes and phenotypes, essentially breaking the relationship between the two. The genome-wide maximum LOD score is then calculated on the permuted data, and this score used as a threshold of statistical significance. A genome-wide maximum LOD on shuffled, or permuted, data serves as the threshold because it represents the highest LOD score generated by random chance.
The scan1perm() function takes the same arguments as
scan1(), plus additional arguments to control the
permutations:
-
n_permis the number of permutation replicates. -
perm_Xspcontrols whether to perform autosome/X chromosome specific permutations (withperm_Xsp=TRUE) or not (the default is FALSE). -
perm_stratais a vector that defines the strata for a stratified permutation test. -
chr_lengthsis a vector of chromosome lengths, used in the case thatperm_Xsp=TRUE.
As with scan1(), you may provide a kinship matrix (or
vector of kinship matrices, for the “leave one chromosome out” (loco)
approach), in order to fit linear mixed models. If kinship
is unspecified, the function performs ordinary Haley-Knott
regression.
To perform a permutation test with the insulin phenotype, we run
scan1perm(), provide it with the genotype probabilities,
the phenotype data, X covariates and number of permutations. We start
with 10 permutations.
R
perm_add <- scan1perm(genoprobs = probs,
                      pheno     = insulin,
                      addcovar  = addcovar,
                      Xcovar    = addcovar,
                      n_perm    = 10)
To get estimated significance thresholds, use the function
summary().
R
summary(perm_add)
OUTPUT
LOD thresholds (10 permutations)
     log10_insulin_10wk
0.05               4.87
The default is to return the 5% significance threshold. Thresholds
for other (or for multiple) significance levels can be obtained via the
alpha argument.
R
summary(perm_add,
        alpha = c(0.2, 0.05))
OUTPUT
LOD thresholds (10 permutations)
     log10_insulin_10wk
0.2                3.82
0.05               4.87
What LOD score did you get with 10 permutations at the 5% significance threshold? Is it the same as the score I got? Is it the same as your neighbor’s LOD score threshold? How do you explain this?
Note the need to specify special covariates for the X chromosome (via
Xcovar), to be included under the null hypothesis of no
QTL. And note that when these are provided, the default is to perform a
stratified permutation test, using strata defined by the rows in
Xcovar. In general, when the X chromosome is considered,
one will wish to stratify at least by sex.
Let’s repeat this process with 100 permutations.
R
perm_add <- scan1perm(genoprobs = probs,
                      pheno     = insulin,
                      addcovar  = addcovar,
                      Xcovar    = addcovar,
                      n_perm    = 100)
R
summary(perm_add)
OUTPUT
LOD thresholds (100 permutations)
     log10_insulin_10wk
0.05               3.96
What LOD score threshold did you get with 100 permutations? Is it the same as the score I got? Is it the same as your neighbor’s LOD score threshold? How much longer did it take your computer to run 100 permutations versus only 10?
Let’s try 1,000 permutations, assuming that your computer was able to complete 100 permutations in a reasonable amount of time (a minute or so). If not, you might want to skip this next iteration because 1,000 permutations will bog down your machine for a long time.
R
perm_add <- scan1perm(genoprobs = probs,
                      pheno     = insulin,
                      addcovar  = addcovar,
                      Xcovar    = addcovar,
                      n_perm    = 1000)
R
summary(perm_add)
OUTPUT
LOD thresholds (1000 permutations)
     log10_insulin_10wk
0.05               3.85
What LOD score threshold did you get with 1,000 permutations? Is it the same as the score I got? Is it the same as your neighbor’s LOD score threshold?
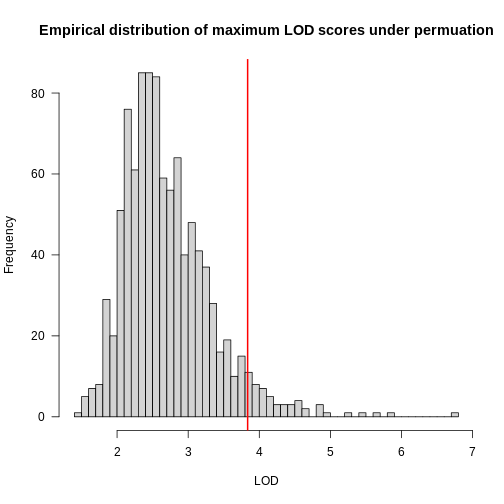
perm_add now contains the maximum LOD score for each
permutation for the phenotypes. There should be 1,000 values for each
phenotype. We can view the insulin permutation LOD scores by making a
histogram.
R
hist(perm_add,
     breaks = 50,
     xlab   = "LOD",
     las    = 1,
     main   = "Empirical distribution of maximum LOD scores under permutation")
abline(v = summary(perm_add), col = 'red', lwd = 2)

In the histogram above, you can see that most of the maximum LOD
scores fall between 1 and 3.5. This means that we expect LOD scores less
than 3.5 to occur by chance fairly often. The red line indicates the
alpha = 0.05 threshold, which means that we only see LOD
values by chance this high or higher, 5% of the time. This is one way
of estimating a significance threshold for QTL plots.
Selecting the Number of Permutations
How do we know how many permutations to perform in order to obtain a good estimate of the significance threshold? Could we get a good estimate with 10 permutations? 100? 1000?
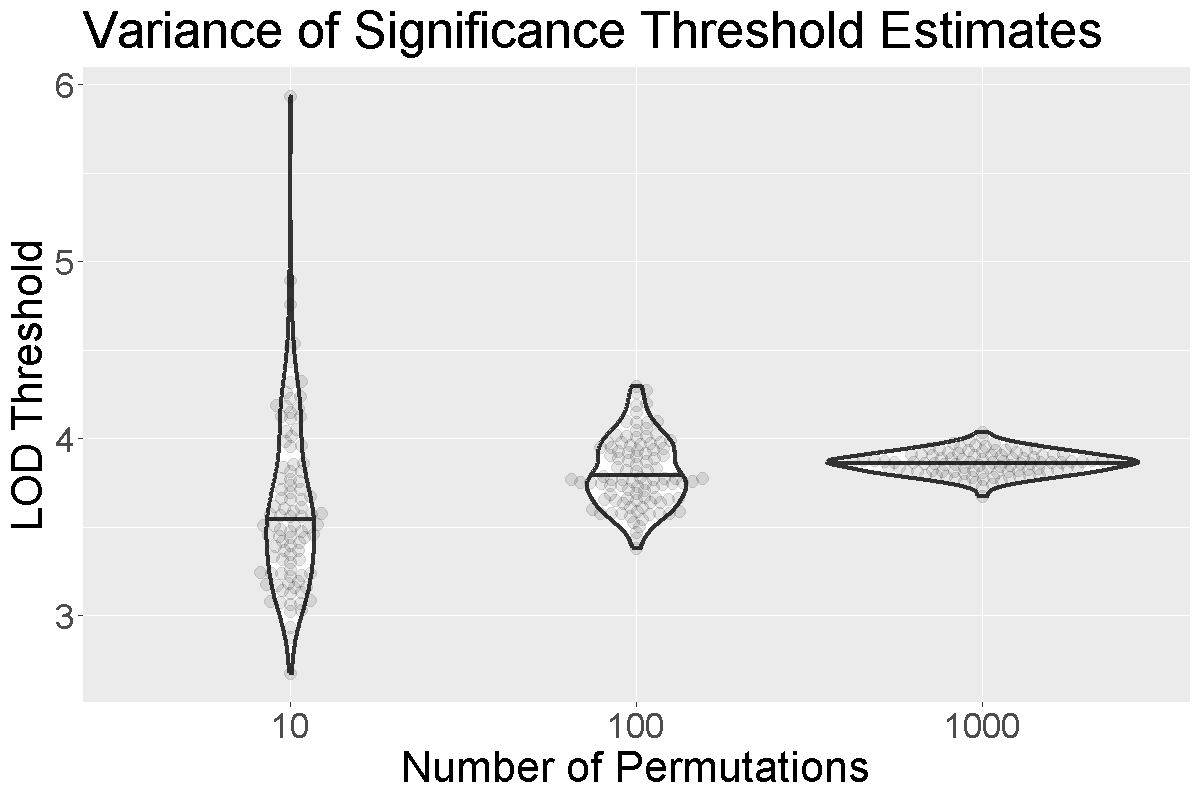
When we run more permutations, we decrease the variance of the threshold estimate.

In the figure above, we performed 10, 100, or 1,000 permutations 1,000 times and recorded the 0.05 significance threshold each time. We plotted the significance threshold versus the number of permutations and overlaid violin plots showing the median value. Note that the variance of the significance threshold estimate is higher at lower numbers of permutations. With 1,000 permutations, the variance decreases. The table below shows the number of permutations and the mean and standard deviation of the significance threshold. With 1,000 permutations, the estimate is 3.86 and the standard deviation is 0.064, which is an acceptable value.
| Num. Perm. | Mean | Std. Dev. |
|---|---|---|
| 10 | 3.63 | 0.492 |
| 100 | 3.81 | 0.195 |
| 1000 | 3.86 | 0.064 |
 As with
 scan1(), you can speed up the calculations on a
multi-core machine by specifying the argument cores. With
cores=0, the number of available cores will be detected via
parallel::detectCores(). Otherwise, specify the number of
cores as a positive integer. For large data sets, be mindful of the
amount of memory that will be needed; you may need to use fewer than the
maximum number of cores, to avoid going beyond the available memory.
R
perm_add <- scan1perm(genoprobs = probs,
                      pheno     = insulin,
                      addcovar  = addcovar,
                      Xcovar    = Xcovar,
                      n_perm    = 1000,
                      cores     = 0)
Estimating an X Chromosome Specific Threshold
To obtain autosome/X chromosome-specific significance thresholds,
specify perm_Xsp=TRUE. In this case, you need to provide
chromosome lengths, which may be obtained with the function
chr_lengths().
R
perm_add2 <- scan1perm(genoprobs   = probs,
                       pheno       = cross$pheno[,"log10_insulin_10wk",drop = FALSE],
                       addcovar    = addcovar,
                       n_perm      = 1000,
                       perm_Xsp    = TRUE,
                       chr_lengths = chr_lengths(cross$pmap))
Separate permutations are performed for the autosomes and X chromosome, and considerably more permutation replicates are needed for the X chromosome. The computations take about twice as much time. See Broman et al. (2006) Genetics 174:2151-2158.
The significance thresholds are again derived via
summary():
R
summary(perm_add2,
        alpha = c(0.2, 0.05))
OUTPUT
Autosome LOD thresholds (1000 permutations)
     log10_insulin_10wk
0.2                3.23
0.05               3.92

X chromosome LOD thresholds (14369 permutations)
     log10_insulin_10wk
0.2                3.08
0.05               3.90
Estimating Significance Thresholds with the Kinship Matrix
You may have noticed above that we did not include the kinship matrix
as an argument to scan1perm. We can include the LOCO
kinship matrices in our permutations, since this is how we mapped
insulin previously.
R
perm_add_loco <- scan1perm(genoprobs = probs,
                           pheno     = insulin,
                           kinship   = kinship_loco,
                           addcovar  = addcovar,
                           n_perm    = 1000)
How does this affect the significance threshold estimates?
R
summary(perm_add_loco,
        alpha = c(0.2, 0.05))
OUTPUT
LOD thresholds (1000 permutations)
     log10_insulin_10wk
0.2                3.14
0.05               3.99
There is not a large difference in the thresholds. Currently, we are on the fence about using the kinship matrices to estimate significance thresholds. In principle, the kinship matrices should be used because we used them when mapping the phenotype. However, in practice, we often find that the significance thresholds are similar to those obtained without including the kinship matrices. Given that it also takes more time to run the permutations with the kinship matrices, it seems reasonable to exclude them.
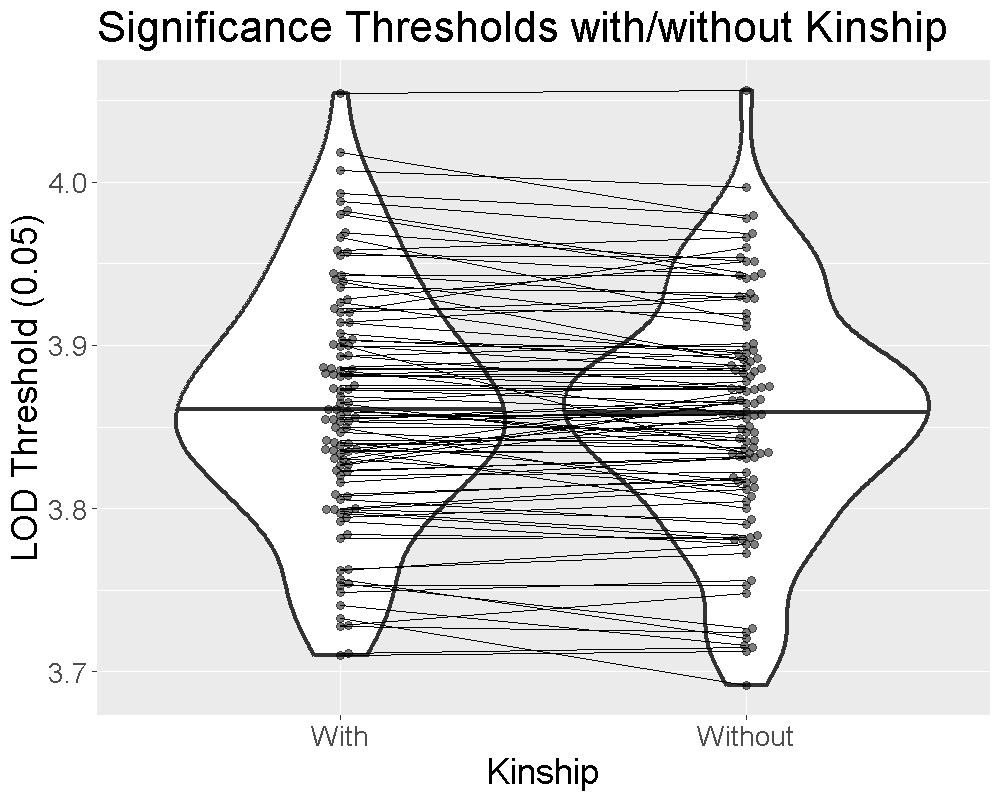
We ran 1000 permutations of the insulin phenotype and estimated the 0.05 significance threshold with and without the kinship matrices. We repeated this process 100 times and plotted the thresholds below.

The plot shows that the median significance threshold is the same. The lines connecting the points denote matched simulations in which the permutation order was the same. While the exact value of the LOD threshold is different, the median value and the variance are similar.
Estimating Binary Model Significance Thresholds
As with scan1, we can use scan1perm with
binary traits, using the argument model="binary". Again,
this can’t be used with a kinship matrix, but all of the other arguments
can be applied.
R
perm_bin <- scan1perm(genoprobs = probs,
                      pheno     = cross$pheno[,"agouti_tan",drop = FALSE],
                      addcovar  = addcovar,
                      n_perm    = 1000,
                      perm_Xsp  = TRUE,
                      chr_lengths = chr_lengths(cross$pmap),
                      model     = "binary")
Here are the estimated 5% and 20% significance thresholds.
R
summary(perm_bin,
        alpha = c(0.2, 0.05))
OUTPUT
Autosome LOD thresholds (1000 permutations)
     agouti_tan
0.2        3.18
0.05       3.91

X chromosome LOD thresholds (14369 permutations)
     agouti_tan
0.2        3.13
0.05       3.80
The code below shuffles the phenotypes so that they no longer match up with the genotypes. The purpose of this is to find out how high the LOD score can be due to random chance alone.
R
shuffled_order <- sample(rownames(cross$pheno))
pheno_permuted <- cross$pheno
rownames(pheno_permuted) <- shuffled_order
xcovar_permuted <- addcovar
rownames(xcovar_permuted) <- shuffled_order
out_permuted <- scan1(genoprobs = probs,
                          pheno = pheno_permuted,
                         Xcovar = xcovar_permuted)
plot(out_permuted, map = cross$pmap)
head(shuffled_order)
Challenge 1:
Run the preceding code to shuffle the phenotype data and plot a genome scan with this shuffled (permuted) data.
What is the maximum LOD score in the scan from this permuted
data?
How does it compare to the maximum LOD scores obtained from the earlier
scan?
How does it compare to the 5% and 20% LOD thresholds obtained
earlier?
Paste the maximum LOD score in the scan from your permuted data into the
etherpad.
Challenge 2
- Find the 1% and 10% significance thresholds for the first set of
permutations contained in the object
perm_add_loco. - What do the 1% and 10% significance thresholds say about LOD scores?
- Use the
alphaargument to supply the desired significance thresholds.
R
summary(perm_add_loco, alpha = c(0.01, 0.10))
OUTPUT
LOD thresholds (1000 permutations)
     log10_insulin_10wk
0.01               4.73
0.1 3.58- These LOD thresholds indicate maximum LOD scores that can be obtained by random chance at the 1% and 10% significance levels. We expect to see LOD values this high or higher 1% and 10% of the time respectively.
- A permutation test establishes the statistical significance of a genome scan.
- 1,000 permutations provides a good estimate of the significance threshold.
